

The German Capability Index—An Operationalization of Sen’s …
167
3.3 Ecological Footprint Germany
Based on these considerations, the Global Footprint Network detected for Germany
that the German population causes an annual ecological footprint of 4.5 ha [25,
43]. This implies that Germany is living beyond its means and needs nearly the
resources of three Earths to provide the annually consumed resources. But the
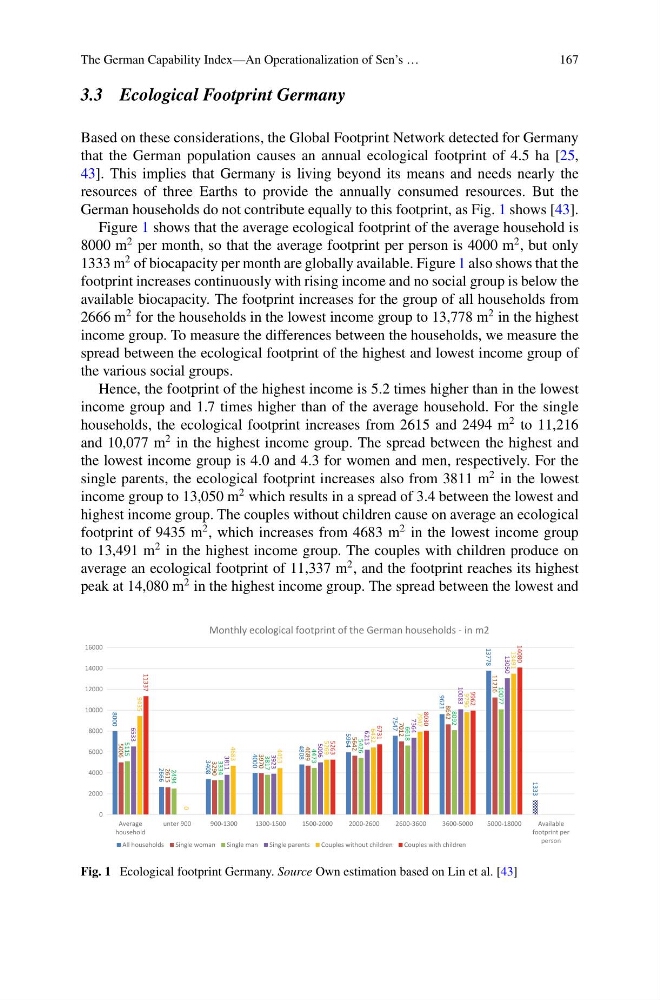
German households do not contribute equally to this footprint, as Fig. 1 shows [43].
Figure 1 shows that the average ecological footprint of the average household is
8000 m
2 per month, so that the average footprint per person is 4000 m
2 , but only
1333 m
2 of biocapacity per month are globally available. Figure 1 also shows that the
footprint increases continuously with rising income and no social group is below the
available biocapacity. The footprint increases for the group of all households from
2666 m
2 for the households in the lowest income group to 13,778 m
2 in the highest
income group. To measure the differences between the households, we measure the
spread between the ecological footprint of the highest and lowest income group of
the various social groups.
Hence, the footprint of the highest income is 5.2 times higher than in the lowest
income group and 1.7 times higher than of the average household. For the single
households, the ecological footprint increases from 2615 and 2494 m
2 to 11,216
and 10,077 m
2 in the highest income group. The spread between the highest and
the lowest income group is 4.0 and 4.3 for women and men, respectively. For the
single parents, the ecological footprint increases also from 3811 m
2 in the lowest
income group to 13,050 m
2 which results in a spread of 3.4 between the lowest and
highest income group. The couples without children cause on average an ecological
footprint of 9435 m
2 , which increases from 4683 m
2 in the lowest income group
to 13,491 m
2 in the highest income group. The couples with children produce on
average an ecological footprint of 11,337 m
2 , and the footprint reaches its highest
peak at 14,080 m
2 in the highest income group. The spread between the lowest and
8000
2666
3408
4000
4808
5964
7547
9621
13778
1333
5006
2615
3290
3970
4689
5642
7012
8642
11216
5115
2494
3334
3817
4473
5426
6618
8092
10077
6533
3811
3923
5006
6213
7364
10083
13050
9435
0
4683
4453
5269
6432
7947
9796
13491
11337
5263
6731
8030
9962
14080
0
2000
4000
6000
8000
10000
12000
14000
16000
Average
household
unter 900
900-1300
1300-1500
1500-2000
2000-2600
2600-3600
3600-5000
5000-18000
Available
footprint per
person
Monthly ecological footprint of the German households - in m2
All households
Single woman
Single man
Single parents
Couples without children
Couples with children
Fig. 1 Ecological footprint Germany. Source Own estimation based on Lin et al. [43]
167
3.3 Ecological Footprint Germany
Based on these considerations, the Global Footprint Network detected for Germany
that the German population causes an annual ecological footprint of 4.5 ha [25,
43]. This implies that Germany is living beyond its means and needs nearly the
resources of three Earths to provide the annually consumed resources. But the
German households do not contribute equally to this footprint, as Fig. 1 shows [43].
Figure 1 shows that the average ecological footprint of the average household is
8000 m
2 per month, so that the average footprint per person is 4000 m
2 , but only
1333 m
2 of biocapacity per month are globally available. Figure 1 also shows that the
footprint increases continuously with rising income and no social group is below the
available biocapacity. The footprint increases for the group of all households from
2666 m
2 for the households in the lowest income group to 13,778 m
2 in the highest
income group. To measure the differences between the households, we measure the
spread between the ecological footprint of the highest and lowest income group of
the various social groups.
Hence, the footprint of the highest income is 5.2 times higher than in the lowest
income group and 1.7 times higher than of the average household. For the single
households, the ecological footprint increases from 2615 and 2494 m
2 to 11,216
and 10,077 m
2 in the highest income group. The spread between the highest and
the lowest income group is 4.0 and 4.3 for women and men, respectively. For the
single parents, the ecological footprint increases also from 3811 m
2 in the lowest
income group to 13,050 m
2 which results in a spread of 3.4 between the lowest and
highest income group. The couples without children cause on average an ecological
footprint of 9435 m
2 , which increases from 4683 m
2 in the lowest income group
to 13,491 m
2 in the highest income group. The couples with children produce on
average an ecological footprint of 11,337 m
2 , and the footprint reaches its highest
peak at 14,080 m
2 in the highest income group. The spread between the lowest and
8000
2666
3408
4000
4808
5964
7547
9621
13778
1333
5006
2615
3290
3970
4689
5642
7012
8642
11216
5115
2494
3334
3817
4473
5426
6618
8092
10077
6533
3811
3923
5006
6213
7364
10083
13050
9435
0
4683
4453
5269
6432
7947
9796
13491
11337
5263
6731
8030
9962
14080
0
2000
4000
6000
8000
10000
12000
14000
16000
Average
household
unter 900
900-1300
1300-1500
1500-2000
2000-2600
2600-3600
3600-5000
5000-18000
Available
footprint per
person
Monthly ecological footprint of the German households - in m2
All households
Single woman
Single man
Single parents
Couples without children
Couples with children
Fig. 1 Ecological footprint Germany. Source Own estimation based on Lin et al. [43]