

Reflections About the Food–Energy–Water Nexus in a World …
5
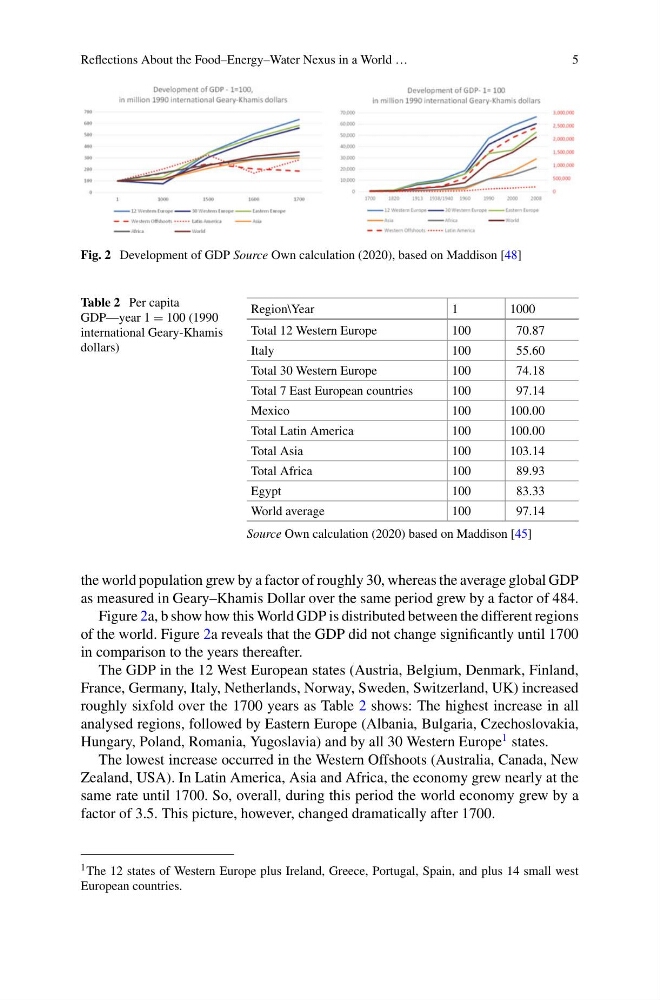
Fig. 2 Development of GDP Source Own calculation (2020), based on Maddison [48]
Table 2 Per capita
GDP—year 1 = 100 (1990
international Geary-Khamis
dollars)
Region\Year
1
1000
Total 12 Western Europe
100
70.87
Italy
100
55.60
Total 30 Western Europe
100
74.18
Total 7 East European countries
100
97.14
Mexico
100
100.00
Total Latin America
100
100.00
Total Asia
100
103.14
Total Africa
100
89.93
Egypt
100
83.33
World average
100
97.14
Source Own calculation (2020) based on Maddison [45]
the world population grew by a factor of roughly 30, whereas the average global GDP
as measured in Geary–Khamis Dollar over the same period grew by a factor of 484.
Figure 2a, b show how this World GDP is distributed between the different regions
of the world. Figure 2a reveals that the GDP did not change significantly until 1700
in comparison to the years thereafter.
The GDP in the 12 West European states (Austria, Belgium, Denmark, Finland,
France, Germany, Italy, Netherlands, Norway, Sweden, Switzerland, UK) increased
roughly sixfold over the 1700 years as Table 2 shows: The highest increase in all
analysed regions, followed by Eastern Europe (Albania, Bulgaria, Czechoslovakia,
Hungary, Poland, Romania, Yugoslavia) and by all 30 Western Europe
1 states.
The lowest increase occurred in the Western Offshoots (Australia, Canada, New
Zealand, USA). In Latin America, Asia and Africa, the economy grew nearly at the
same rate until 1700. So, overall, during this period the world economy grew by a
factor of 3.5. This picture, however, changed dramatically after 1700.
1 The 12 states of Western Europe plus Ireland, Greece, Portugal, Spain, and plus 14 small west
European countries.
5
Fig. 2 Development of GDP Source Own calculation (2020), based on Maddison [48]
Table 2 Per capita
GDP—year 1 = 100 (1990
international Geary-Khamis
dollars)
Region\Year
1
1000
Total 12 Western Europe
100
70.87
Italy
100
55.60
Total 30 Western Europe
100
74.18
Total 7 East European countries
100
97.14
Mexico
100
100.00
Total Latin America
100
100.00
Total Asia
100
103.14
Total Africa
100
89.93
Egypt
100
83.33
World average
100
97.14
Source Own calculation (2020) based on Maddison [45]
the world population grew by a factor of roughly 30, whereas the average global GDP
as measured in Geary–Khamis Dollar over the same period grew by a factor of 484.
Figure 2a, b show how this World GDP is distributed between the different regions
of the world. Figure 2a reveals that the GDP did not change significantly until 1700
in comparison to the years thereafter.
The GDP in the 12 West European states (Austria, Belgium, Denmark, Finland,
France, Germany, Italy, Netherlands, Norway, Sweden, Switzerland, UK) increased
roughly sixfold over the 1700 years as Table 2 shows: The highest increase in all
analysed regions, followed by Eastern Europe (Albania, Bulgaria, Czechoslovakia,
Hungary, Poland, Romania, Yugoslavia) and by all 30 Western Europe
1 states.
The lowest increase occurred in the Western Offshoots (Australia, Canada, New
Zealand, USA). In Latin America, Asia and Africa, the economy grew nearly at the
same rate until 1700. So, overall, during this period the world economy grew by a
factor of 3.5. This picture, however, changed dramatically after 1700.
1 The 12 states of Western Europe plus Ireland, Greece, Portugal, Spain, and plus 14 small west
European countries.