

24
and to other known climate changes in the past, thus helping us understand the processes that drive change in these coastal environments, and how they will respond
to future climate change.
The barrier islands are not the only place we work to understand the changes
affecting the coast. Our research takes us on the water as well. We have spent years
traversing, mapping, and sampling the estuaries of eastern North Carolina. Pamlico
and Albemarle Sounds are the largest, but the smaller estuaries, for example Croatan,
Roanoke and Currituck sounds, near to Albemarle Sound (Fig. 2.1) and Core Sound,
south of Pamlico Sound (Fig. 2.1), also contain secrets. Much of the work has
involved surveying the seabed and the layers of sediment below and collecting bottom samples and cores.
Reflecting on Rising Seas
We depart the dock in Washington, NC shortly after sunrise and navigate the R/V
Stanley R. Riggs, a 34-foot aluminum craft built for just this type of work, to the larger
reaches of Pamlico Sound to begin a survey. Following an invigorating high- speed
cruise propelled by twin Volvo diesel engines, we slow to walking speed and deploy a
three-foot long yellow submarine-looking device called a CHIRP (Compressed HighIntensity Radiated Pulse) subbottom profiler (Fig. 2.9). This device sends highlytuned sound energy of multiple frequencies through the water column and into the
underlying sediment every half second. The sound is much like the chirping of a bird.
It rises quickly from low frequency to high frequency in every half-second cycle. The
energy enters the sediment and an echo is reflected back up toward the surface wherever a change is encountered in the density of the sediment and the velocity of the
sound. That echo (or “reflection”) is then received by the CHIRP profiler, transmitted
up a cable, amplified, digitally sampled by a computer, and shown on a computer
screen. The result is an image of the layers of sediment beneath the seafloor (Fig. 2.10).
The images that are revealed remind us of the incredible changes that the Earth
has undergone as sea level has fallen and risen multiple times over tens to hundreds
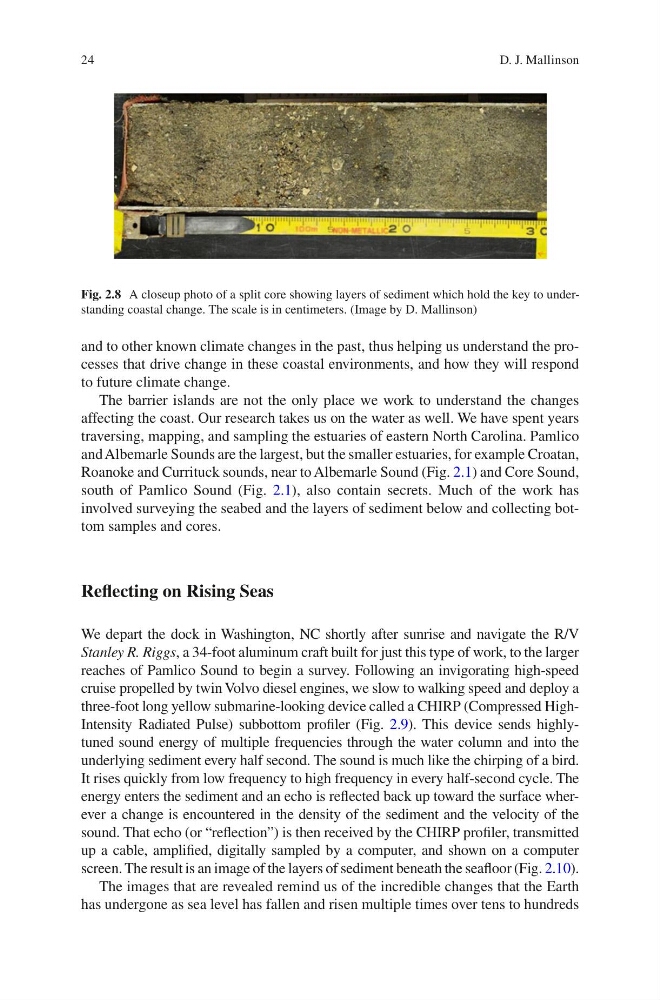
Fig. 2.8 A closeup photo of a split core showing layers of sediment which hold the key to understanding coastal change. The scale is in centimeters. (Image by D. Mallinson)
D. J. Mallinson
and to other known climate changes in the past, thus helping us understand the processes that drive change in these coastal environments, and how they will respond
to future climate change.
The barrier islands are not the only place we work to understand the changes
affecting the coast. Our research takes us on the water as well. We have spent years
traversing, mapping, and sampling the estuaries of eastern North Carolina. Pamlico
and Albemarle Sounds are the largest, but the smaller estuaries, for example Croatan,
Roanoke and Currituck sounds, near to Albemarle Sound (Fig. 2.1) and Core Sound,
south of Pamlico Sound (Fig. 2.1), also contain secrets. Much of the work has
involved surveying the seabed and the layers of sediment below and collecting bottom samples and cores.
Reflecting on Rising Seas
We depart the dock in Washington, NC shortly after sunrise and navigate the R/V
Stanley R. Riggs, a 34-foot aluminum craft built for just this type of work, to the larger
reaches of Pamlico Sound to begin a survey. Following an invigorating high- speed
cruise propelled by twin Volvo diesel engines, we slow to walking speed and deploy a
three-foot long yellow submarine-looking device called a CHIRP (Compressed HighIntensity Radiated Pulse) subbottom profiler (Fig. 2.9). This device sends highlytuned sound energy of multiple frequencies through the water column and into the
underlying sediment every half second. The sound is much like the chirping of a bird.
It rises quickly from low frequency to high frequency in every half-second cycle. The
energy enters the sediment and an echo is reflected back up toward the surface wherever a change is encountered in the density of the sediment and the velocity of the
sound. That echo (or “reflection”) is then received by the CHIRP profiler, transmitted
up a cable, amplified, digitally sampled by a computer, and shown on a computer
screen. The result is an image of the layers of sediment beneath the seafloor (Fig. 2.10).
The images that are revealed remind us of the incredible changes that the Earth
has undergone as sea level has fallen and risen multiple times over tens to hundreds
Fig. 2.8 A closeup photo of a split core showing layers of sediment which hold the key to understanding coastal change. The scale is in centimeters. (Image by D. Mallinson)
D. J. Mallinson