

225
of Rhode Island and meeting new colleagues from Silliman University, a university
based in the Southern Negros city of Dumaguete. The view from the plane as we
cross over the islands of the Philippines (a country with over 7000 islands) is spectacular. What makes it even more impressive is the extraordinary colors in the sky
as the sun sets and our plane comes in for a landing at a small airstrip that starts right
at the seaward edge of the island. Shortly after we land, we meet with our colleagues
at the University’s Marine Science Campus to discuss plans for tomorrow – meet at
5 am and drive 4 h to Sipalay on the north end of the island. Waking up at 4 am to
meet at 5 would be a recurring theme for the next 8 days.
We brought with us a number of different instruments and devices to collect
information about the structure and function of coastal habitats: a single beam sonar
that works in a similar way to a LiDAR (see the chapters by Farrell and Walsh) but
instead of light it measures sound; a drone for capturing the coastal continuum mangroves, mudflats, seagrass, and coral reefs (Fig. 13.10); a plurality of waterproof cameras that we have attached to various poles and cages so that we can see
what is on the seafloor: and sediment coring devices that allow you to collect undisturbed sediment in a cylindrical tube.
The sonar sends sound waves out from the sensors down to the seafloor. Because
we know how fast sound travels through water, the amount of time that the sound
travels can give us information on the depth of the seafloor. But we can also use the
strength (the intensity of the sound) and the variability (flat vs rough) of the returned
sound to suggest what is on the seabed. In most cases, since we were working in
clear, shallow water environments, we could easily see what was on the seafloor by
just looking over the edge of the boat (Fig. 13.11). But we wanted to make sure that
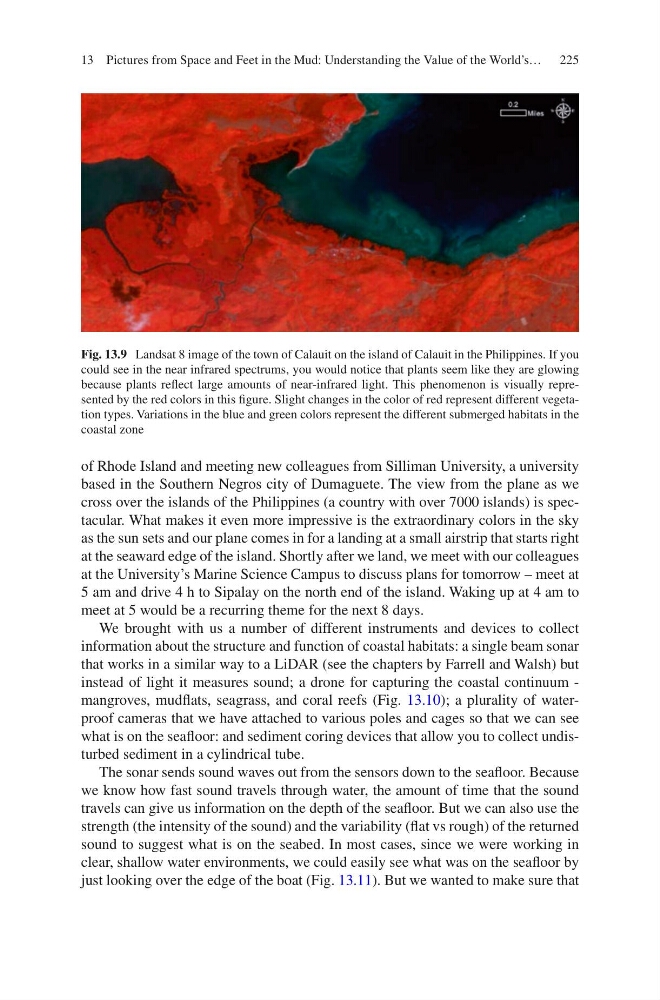
Fig. 13.9 Landsat 8 image of the town of Calauit on the island of Calauit in the Philippines. If you
could see in the near infrared spectrums, you would notice that plants seem like they are glowing
because plants reflect large amounts of near-infrared light. This phenomenon is visually represented by the red colors in this figure. Slight changes in the color of red represent different vegetation types. Variations in the blue and green colors represent the different submerged habitats in the
coastal zone
13 Pictures from Space and Feet in the Mud: Understanding the Value of the World’s…
of Rhode Island and meeting new colleagues from Silliman University, a university
based in the Southern Negros city of Dumaguete. The view from the plane as we
cross over the islands of the Philippines (a country with over 7000 islands) is spectacular. What makes it even more impressive is the extraordinary colors in the sky
as the sun sets and our plane comes in for a landing at a small airstrip that starts right
at the seaward edge of the island. Shortly after we land, we meet with our colleagues
at the University’s Marine Science Campus to discuss plans for tomorrow – meet at
5 am and drive 4 h to Sipalay on the north end of the island. Waking up at 4 am to
meet at 5 would be a recurring theme for the next 8 days.
We brought with us a number of different instruments and devices to collect
information about the structure and function of coastal habitats: a single beam sonar
that works in a similar way to a LiDAR (see the chapters by Farrell and Walsh) but
instead of light it measures sound; a drone for capturing the coastal continuum mangroves, mudflats, seagrass, and coral reefs (Fig. 13.10); a plurality of waterproof cameras that we have attached to various poles and cages so that we can see
what is on the seafloor: and sediment coring devices that allow you to collect undisturbed sediment in a cylindrical tube.
The sonar sends sound waves out from the sensors down to the seafloor. Because
we know how fast sound travels through water, the amount of time that the sound
travels can give us information on the depth of the seafloor. But we can also use the
strength (the intensity of the sound) and the variability (flat vs rough) of the returned
sound to suggest what is on the seabed. In most cases, since we were working in
clear, shallow water environments, we could easily see what was on the seafloor by
just looking over the edge of the boat (Fig. 13.11). But we wanted to make sure that
Fig. 13.9 Landsat 8 image of the town of Calauit on the island of Calauit in the Philippines. If you
could see in the near infrared spectrums, you would notice that plants seem like they are glowing
because plants reflect large amounts of near-infrared light. This phenomenon is visually represented by the red colors in this figure. Slight changes in the color of red represent different vegetation types. Variations in the blue and green colors represent the different submerged habitats in the
coastal zone
13 Pictures from Space and Feet in the Mud: Understanding the Value of the World’s…