

872
D. Matsuura et al.
Table 2 Test patterns
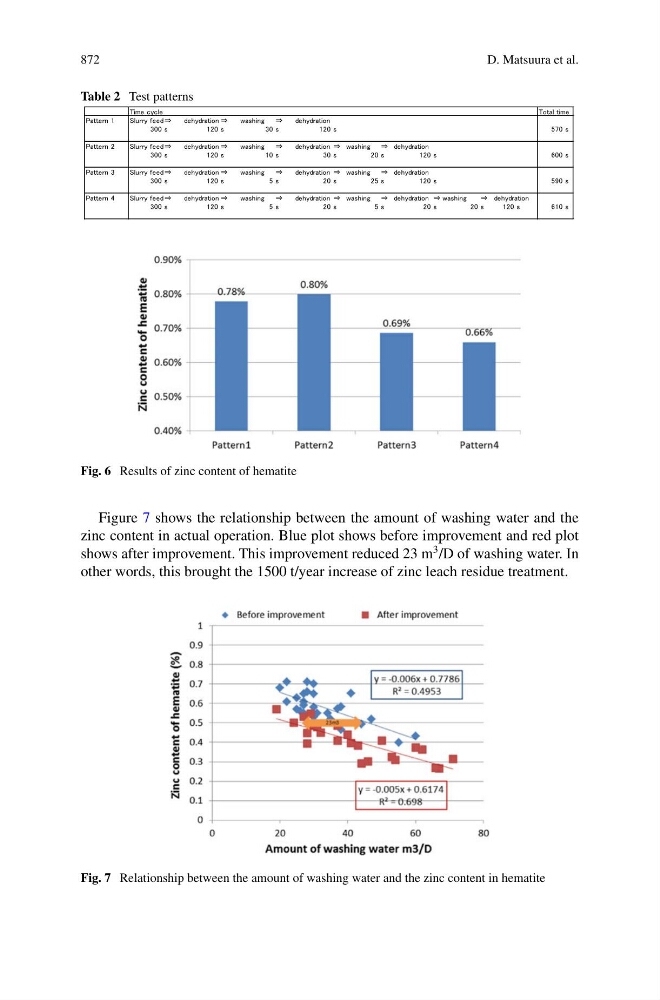
Fig. 6 Results of zinc content of hematite
Figure 7 shows the relationship between the amount of washing water and the
zinc content in actual operation. Blue plot shows before improvement and red plot
shows after improvement. This improvement reduced 23 m
3 /D of washing water. In
other words, this brought the 1500 t/year increase of zinc leach residue treatment.
Fig. 7 Relationship between the amount of washing water and the zinc content in hematite