

804
S. Stoychev et al.
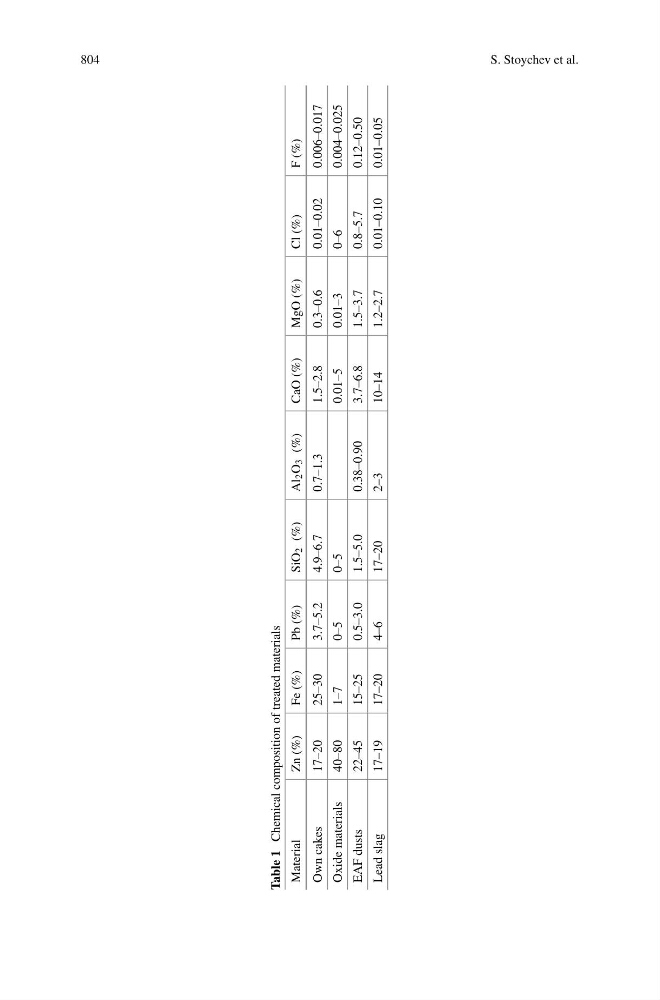
Table 1
Chemical composition of treated materials
Material
Zn (%)
Fe (%)
Pb (%)
SiO
2 (%)
Al
2 O
3 (%)
CaO (%)
MgO (%)
Cl (%)
F (%)
Own cakes
17–20
25–30
3.7–5.2
4.9–6.7
0.7–1.3
1.5–2.8
0.3–0.6
0.01–0.02
0.006–0.017
Oxide materials
40–80
1–7
0–5
0–5
0.01–5
0.01–3
0–6
0.004–0.025
EAF dusts
22–45
15–25
0.5–3.0
1.5–5.0
0.38–0.90
3.7–6.8
1.5–3.7
0.8–5.7
0.12–0.50
Lead slag
17–19
17–20
4–6
17–20
2–3
10–14
1.2–2.7
0.01–0.10
0.01–0.05