

Driving Innovation in Lead Batteries: The Focus of the …
723
Indicator
2019
2022
2025
DCA. A/Ah
0
.
2
0
.
2
4
.
0
PSoC, 17.5% DoD
1500 EFB
2000 EFB
3000 EFB
Water loss, g/Ah
3
<
3
<
3
<
Corrosion, J2801, Units
2
2
8
1
2
1
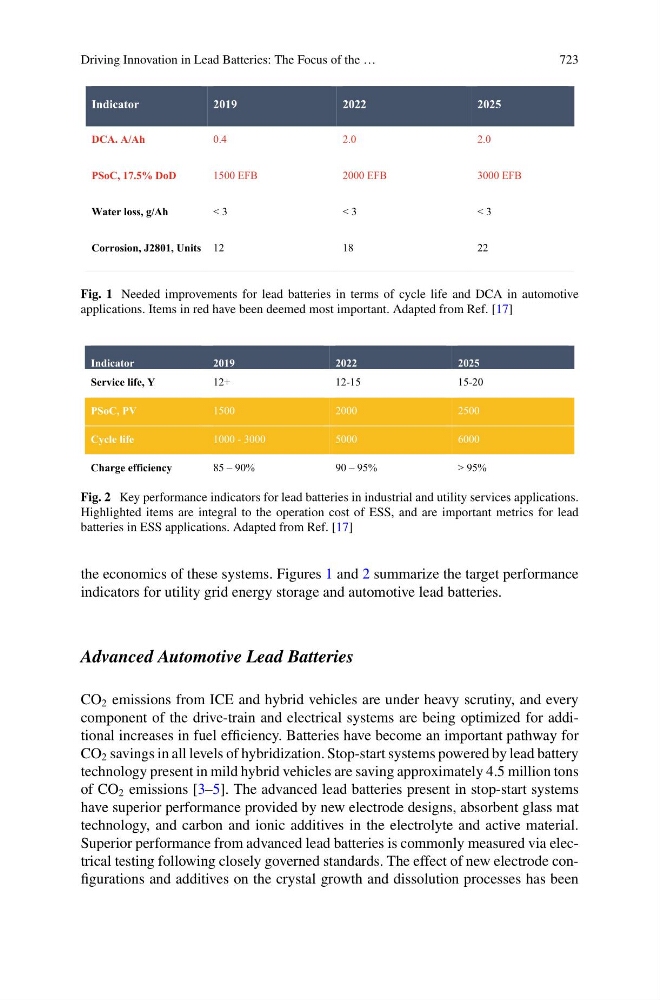
Fig. 1 Needed improvements for lead batteries in terms of cycle life and DCA in automotive
applications. Items in red have been deemed most important. Adapted from Ref. [17]
Indicator
2019
2022
2025
Service life, Y
12+
12-15
15-20
PSoC, PV
1500
2000
2500
Cycle life
1000 - 3000
5000
6000
Charge efficiency
85 – 90%
90 – 95%
> 95%
Fig. 2 Key performance indicators for lead batteries in industrial and utility services applications.
Highlighted items are integral to the operation cost of ESS, and are important metrics for lead
batteries in ESS applications. Adapted from Ref. [17]
the economics of these systems. Figures 1 and 2 summarize the target performance
indicators for utility grid energy storage and automotive lead batteries.
Advanced Automotive Lead Batteries
CO 2 emissions from ICE and hybrid vehicles are under heavy scrutiny, and every
component of the drive-train and electrical systems are being optimized for additional increases in fuel efficiency. Batteries have become an important pathway for
CO 2 savings in all levels of hybridization. Stop-start systems powered by lead battery
technology present in mild hybrid vehicles are saving approximately 4.5 million tons
of CO 2 emissions [3–5]. The advanced lead batteries present in stop-start systems
have superior performance provided by new electrode designs, absorbent glass mat
technology, and carbon and ionic additives in the electrolyte and active material.
Superior performance from advanced lead batteries is commonly measured via electrical testing following closely governed standards. The effect of new electrode configurations and additives on the crystal growth and dissolution processes has been