

Optimization of Arsenic Removal Process in Waste Acid …
713
Table 5 Results of the
proving experiment
As concentration
of raw materials
(mg/L)
The residual
concentration of
As (mg/L)
The removal rate
of As (%)
629
52
91.73
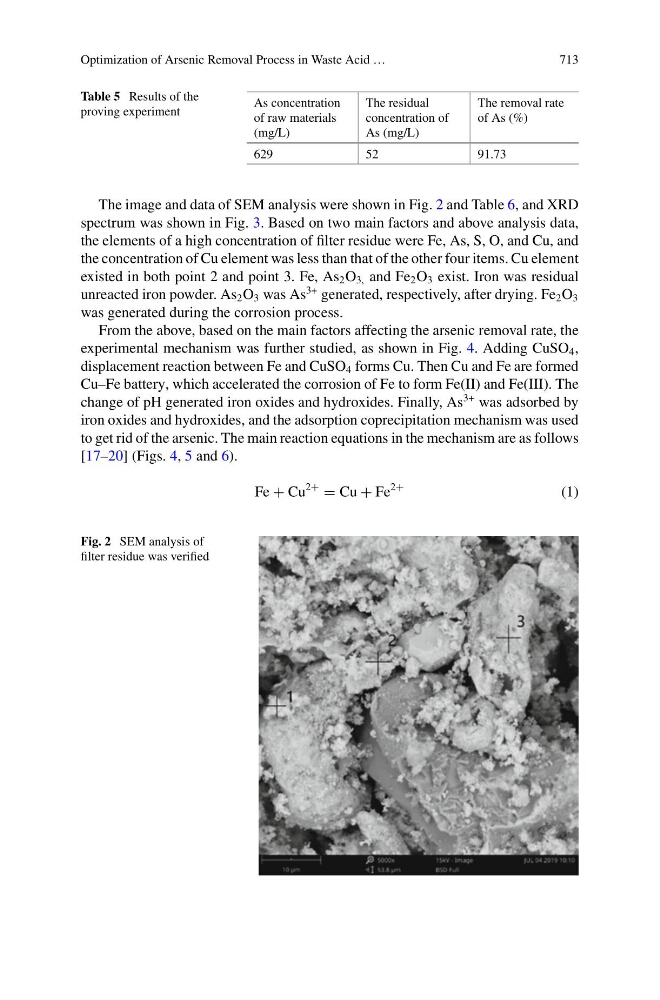
The image and data of SEM analysis were shown in Fig. 2 and Table 6, and XRD
spectrum was shown in Fig. 3. Based on two main factors and above analysis data,
the elements of a high concentration of filter residue were Fe, As, S, O, and Cu, and
the concentration of Cu element was less than that of the other four items. Cu element
existed in both point 2 and point 3. Fe, As 2 O 3, and Fe 2 O 3 exist. Iron was residual
unreacted iron powder. As 2 O 3 was As
3+ generated, respectively, after drying. Fe 2 O 3
was generated during the corrosion process.
From the above, based on the main factors affecting the arsenic removal rate, the
experimental mechanism was further studied, as shown in Fig. 4. Adding CuSO 4 ,
displacement reaction between Fe and CuSO 4 forms Cu. Then Cu and Fe are formed
Cu–Fe battery, which accelerated the corrosion of Fe to form Fe(II) and Fe(III). The
change of pH generated iron oxides and hydroxides. Finally, As
3+ was adsorbed by
iron oxides and hydroxides, and the adsorption coprecipitation mechanism was used
to get rid of the arsenic. The main reaction equations in the mechanism are as follows
[17–20] (Figs. 4, 5 and 6).
Fe + Cu
2+
= Cu + Fe
2+
(1)
Fig. 2 SEM analysis of
filter residue was verified