

438
J. Antrekowitsch and G. Hanke
It was estimated that these residues contain metal values of one to two billion
USD [1]. Important to note is that these numbers are steadily growing and merely
represent the amount of newly created jarosite every year.
In general, only a few concepts for reprocessing are existing, showing various
disadvantages like high energy consumption, the recovery of only one metal, or
complex process flow sheets leading to high operational costs [2].
The morphology of the material is of high importance for possible processing steps. Therefore, the characterization of typical zinc smelter leach residues is
described in the following chapter.
Characterization
The complexity of zinc leach residues and the small grain size makes a detailed
and clear characterization difficult. Often, jarosite or goethite residues do not only
contain the iron compound, responsible for its name but also different other materials. Examples are remaining solids, not separated by filtration, leaching residues
containing lead and silver, not dissolved calcine, added for pH-adjustment, etc. Out
of this, residues from hydrometallurgical zinc smelters can vary a lot, even though
the underlying procedures and basics should be quite similar. As the development of
any kind of treatment needs detailed knowledge of the materials’ properties, characterization is of major importance. Most of all, the particles of very small grain size,
which are very common, cause problems. Amorphous phases are additionally difficult to handle with some methods like x-ray diffraction analysis for mineralogical
analysis [3].
Samples from different zinc plants were collected. Strew samples were used to
get basic information about the morphology and grain size. For detailed measurements, it is necessary to use polished sections. Various methods like scanning electron
microscopy, microprobe analysis, x-ray diffraction analysis, ICP-MS/OES (inductively coupled plasma-mass spectrometry/optical emission spectrometry), and fire
assay were employed to investigate the material.
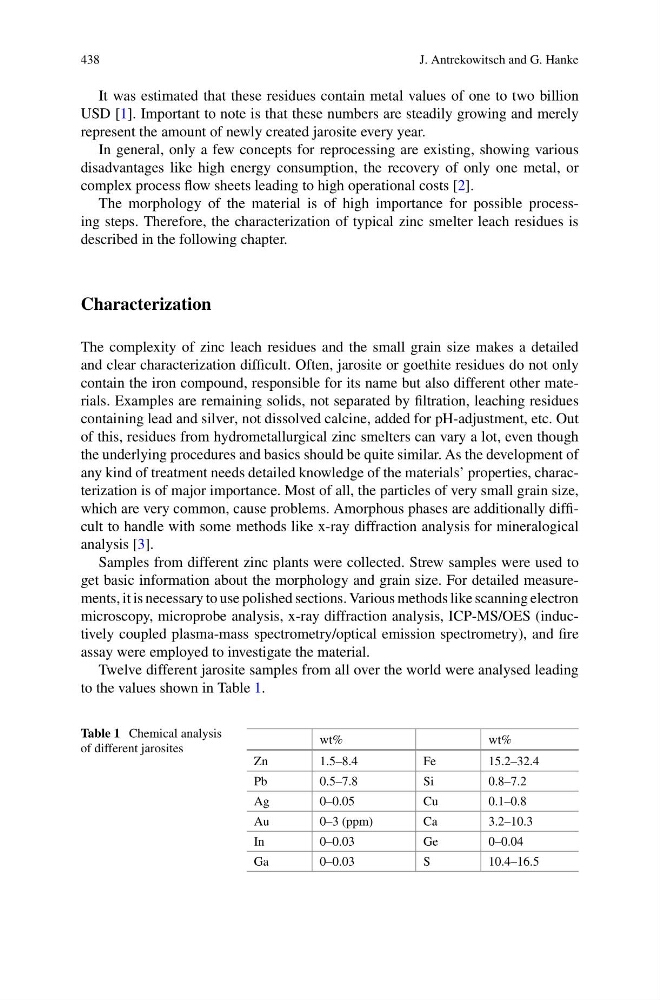
Twelve different jarosite samples from all over the world were analysed leading
to the values shown in Table 1.
Table 1 Chemical analysis
of different jarosites
wt%
wt%
Zn
1.5–8.4
Fe
15.2–32.4
Pb
0.5–7.8
Si
0.8–7.2
Ag
0–0.05
Cu
0.1–0.8
Au
0–3 (ppm)
Ca
3.2–10.3
In
0–0.03
Ge
0–0.04
Ga
0–0.03
S
10.4–16.5
J. Antrekowitsch and G. Hanke
It was estimated that these residues contain metal values of one to two billion
USD [1]. Important to note is that these numbers are steadily growing and merely
represent the amount of newly created jarosite every year.
In general, only a few concepts for reprocessing are existing, showing various
disadvantages like high energy consumption, the recovery of only one metal, or
complex process flow sheets leading to high operational costs [2].
The morphology of the material is of high importance for possible processing steps. Therefore, the characterization of typical zinc smelter leach residues is
described in the following chapter.
Characterization
The complexity of zinc leach residues and the small grain size makes a detailed
and clear characterization difficult. Often, jarosite or goethite residues do not only
contain the iron compound, responsible for its name but also different other materials. Examples are remaining solids, not separated by filtration, leaching residues
containing lead and silver, not dissolved calcine, added for pH-adjustment, etc. Out
of this, residues from hydrometallurgical zinc smelters can vary a lot, even though
the underlying procedures and basics should be quite similar. As the development of
any kind of treatment needs detailed knowledge of the materials’ properties, characterization is of major importance. Most of all, the particles of very small grain size,
which are very common, cause problems. Amorphous phases are additionally difficult to handle with some methods like x-ray diffraction analysis for mineralogical
analysis [3].
Samples from different zinc plants were collected. Strew samples were used to
get basic information about the morphology and grain size. For detailed measurements, it is necessary to use polished sections. Various methods like scanning electron
microscopy, microprobe analysis, x-ray diffraction analysis, ICP-MS/OES (inductively coupled plasma-mass spectrometry/optical emission spectrometry), and fire
assay were employed to investigate the material.
Twelve different jarosite samples from all over the world were analysed leading
to the values shown in Table 1.
Table 1 Chemical analysis
of different jarosites
wt%
wt%
Zn
1.5–8.4
Fe
15.2–32.4
Pb
0.5–7.8
Si
0.8–7.2
Ag
0–0.05
Cu
0.1–0.8
Au
0–3 (ppm)
Ca
3.2–10.3
In
0–0.03
Ge
0–0.04
Ga
0–0.03
S
10.4–16.5