

322
N. Starev and G. Doganov
the zinc plant, as well as the recycled dust in the form of cake, generated by the
metallurgical process in the TSL Furnace. Fluxes added for slag chemistry control
includes iron-containing material (roasted iron pyrites), silica, and lime-ash.
The feed rates are as follows: lead concentrates 16–19, lead cakes 3–4, and lead
paste around 4 t/h. The chemical analysis of the feed materials is shown in Table 1.
Recycled dust from the process of around 14% moisture is fed at a rate of 4–8 t/h.
The average analysis is shown in Table 2.
The average flux additions are approximately 2 t/h.
Since the beginning of 2018, the share of secondary feeds has steadily increased
from 20 to 27%.
The average direct lead recovery achieved in the first quarter of 2018 is 74.4%.
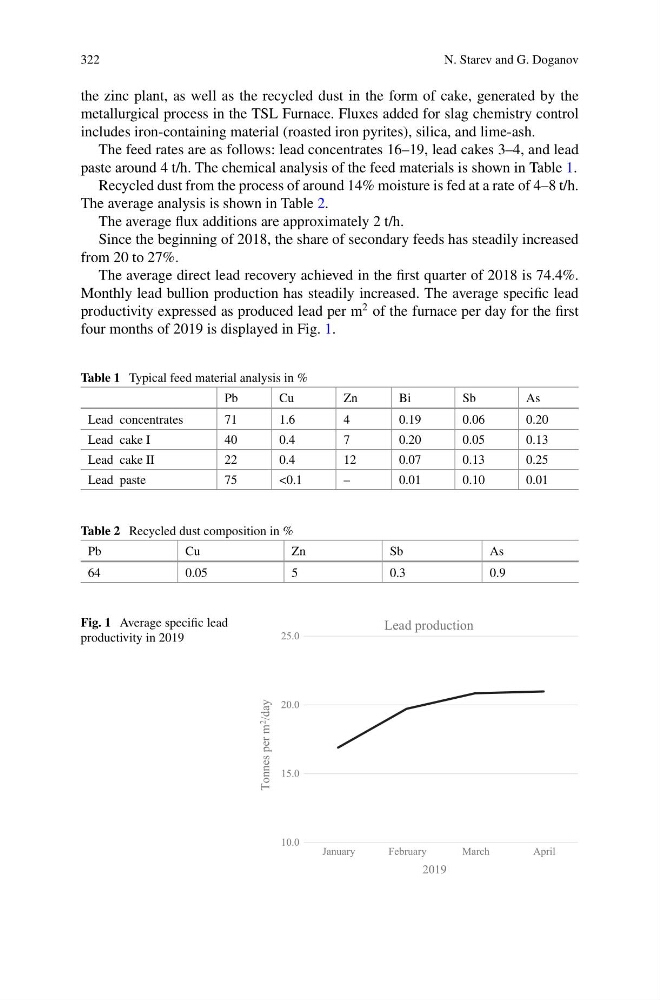
Monthly lead bullion production has steadily increased. The average specific lead
productivity expressed as produced lead per m
2 of the furnace per day for the first
four months of 2019 is displayed in Fig. 1.
Table 1 Typical feed material analysis in %
Pb
Cu
Zn
Bi
Sb
As
Lead concentrates
71
1.6
4
0.19
0.06
0.20
Lead cake I
40
0.4
7
0.20
0.05
0.13
Lead cake II
22
0.4
12
0.07
0.13
0.25
Lead paste
75
<0.1
–
0.01
0.10
0.01
Table 2 Recycled dust composition in %
Pb
Cu
Zn
Sb
As
64
0.05
5
0.3
0.9
Fig. 1 Average specific lead
productivity in 2019
10.0
15.0
20.0
25.0
January
February
March
April
Tonnes per m 2
/day
2019
Lead production
N. Starev and G. Doganov
the zinc plant, as well as the recycled dust in the form of cake, generated by the
metallurgical process in the TSL Furnace. Fluxes added for slag chemistry control
includes iron-containing material (roasted iron pyrites), silica, and lime-ash.
The feed rates are as follows: lead concentrates 16–19, lead cakes 3–4, and lead
paste around 4 t/h. The chemical analysis of the feed materials is shown in Table 1.
Recycled dust from the process of around 14% moisture is fed at a rate of 4–8 t/h.
The average analysis is shown in Table 2.
The average flux additions are approximately 2 t/h.
Since the beginning of 2018, the share of secondary feeds has steadily increased
from 20 to 27%.
The average direct lead recovery achieved in the first quarter of 2018 is 74.4%.
Monthly lead bullion production has steadily increased. The average specific lead
productivity expressed as produced lead per m
2 of the furnace per day for the first
four months of 2019 is displayed in Fig. 1.
Table 1 Typical feed material analysis in %
Pb
Cu
Zn
Bi
Sb
As
Lead concentrates
71
1.6
4
0.19
0.06
0.20
Lead cake I
40
0.4
7
0.20
0.05
0.13
Lead cake II
22
0.4
12
0.07
0.13
0.25
Lead paste
75
<0.1
–
0.01
0.10
0.01
Table 2 Recycled dust composition in %
Pb
Cu
Zn
Sb
As
64
0.05
5
0.3
0.9
Fig. 1 Average specific lead
productivity in 2019
10.0
15.0
20.0
25.0
January
February
March
April
Tonnes per m 2
/day
2019
Lead production