

122
7 Molten Salt Conversion of Plastics into Highly Conductive …
is attributed to the residual salt, which could not be removed during the washing
process. The (002) reflection of the hexagonal carbon structure appears at the 2θ
value of 25.13°, representing an interplanar spacing of 3.54 Å. The broad peak
observed with the maxima at the 2θ value of 43.18° is attributed to overlapping
(100) and (101) reflections of hexagonal carbon. In the Raman spectrum of the carbon
material obtained by heating the mixture of PET and NaCl 1100 °C (the lower panel
of Fig. 7.7), the defect-induced D band and the G band which correspond to the
stretching vibrations of the basal carbon layers in carbon materials [53, 54] appear
at the Raman shift values of 1372 and 1599 cm
−1 , respectively. Furthermore, the
overtone of the D band, the 2D band, observed at 2703 cm
−1 has a low intensity.
The level of defects, or inversely, the graphitization degree of the carbon material
can be evaluated from the intensity ratio I D /I G [53, 54], which was found to be 0.94.
Moreover, the quality of the graphene sheets exists in the carbon product could be
assessed from the intensity ratio I 2D /I G , which was measured to be 0.23. Overall, the
presence of nanocrystalline graphitized domains can be realized from the XRD and
Raman results.
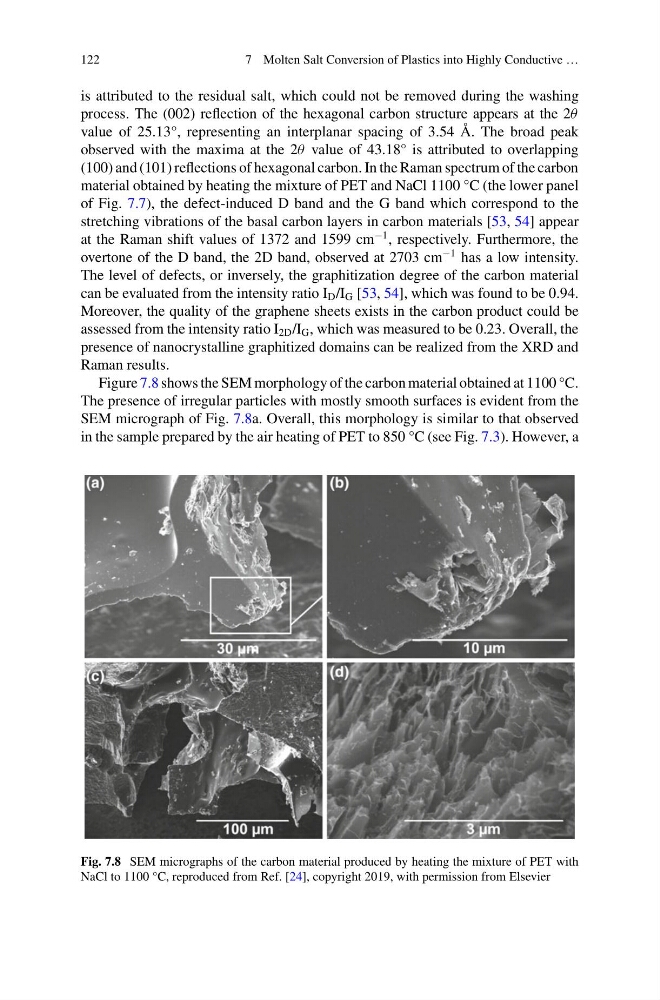
Figure 7.8 shows the SEM morphology of the carbon material obtained at 1100 °C.
The presence of irregular particles with mostly smooth surfaces is evident from the
SEM micrograph of Fig. 7.8a. Overall, this morphology is similar to that observed
in the sample prepared by the air heating of PET to 850 °C (see Fig. 7.3). However, a
Fig. 7.8 SEM micrographs of the carbon material produced by heating the mixture of PET with
NaCl to 1100 °C, reproduced from Ref. [24], copyright 2019, with permission from Elsevier
7 Molten Salt Conversion of Plastics into Highly Conductive …
is attributed to the residual salt, which could not be removed during the washing
process. The (002) reflection of the hexagonal carbon structure appears at the 2θ
value of 25.13°, representing an interplanar spacing of 3.54 Å. The broad peak
observed with the maxima at the 2θ value of 43.18° is attributed to overlapping
(100) and (101) reflections of hexagonal carbon. In the Raman spectrum of the carbon
material obtained by heating the mixture of PET and NaCl 1100 °C (the lower panel
of Fig. 7.7), the defect-induced D band and the G band which correspond to the
stretching vibrations of the basal carbon layers in carbon materials [53, 54] appear
at the Raman shift values of 1372 and 1599 cm
−1 , respectively. Furthermore, the
overtone of the D band, the 2D band, observed at 2703 cm
−1 has a low intensity.
The level of defects, or inversely, the graphitization degree of the carbon material
can be evaluated from the intensity ratio I D /I G [53, 54], which was found to be 0.94.
Moreover, the quality of the graphene sheets exists in the carbon product could be
assessed from the intensity ratio I 2D /I G , which was measured to be 0.23. Overall, the
presence of nanocrystalline graphitized domains can be realized from the XRD and
Raman results.
Figure 7.8 shows the SEM morphology of the carbon material obtained at 1100 °C.
The presence of irregular particles with mostly smooth surfaces is evident from the
SEM micrograph of Fig. 7.8a. Overall, this morphology is similar to that observed
in the sample prepared by the air heating of PET to 850 °C (see Fig. 7.3). However, a
Fig. 7.8 SEM micrographs of the carbon material produced by heating the mixture of PET with
NaCl to 1100 °C, reproduced from Ref. [24], copyright 2019, with permission from Elsevier