

7.1 Structural Characterization of PET
111
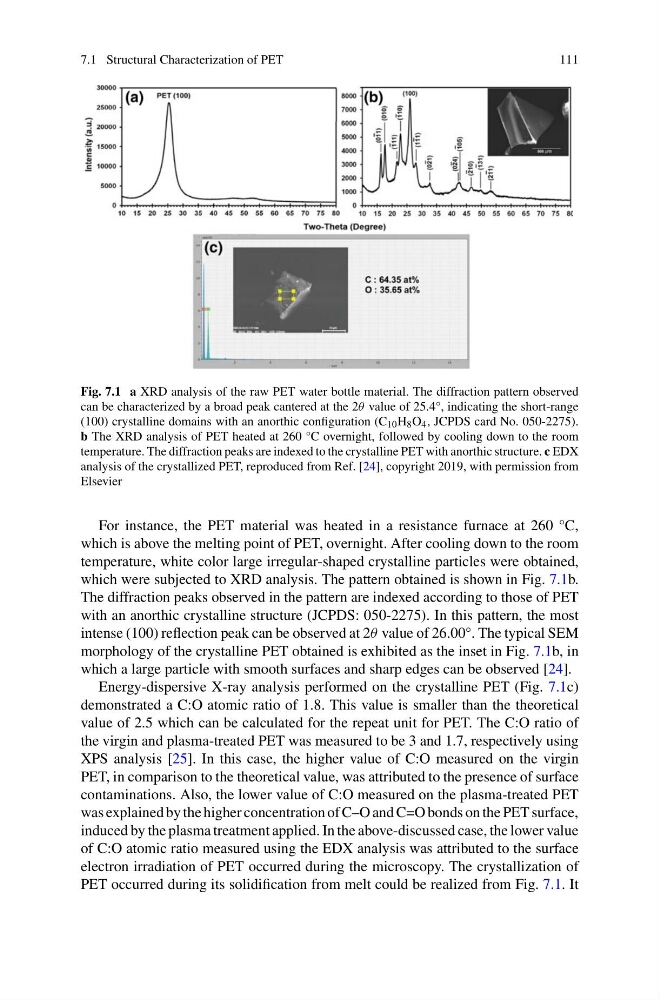
Fig. 7.1 a XRD analysis of the raw PET water bottle material. The diffraction pattern observed
can be characterized by a broad peak cantered at the 2θ value of 25.4°, indicating the short-range
(100) crystalline domains with an anorthic configuration (C 10 H 8 O 4 , JCPDS card No. 050-2275).
b The XRD analysis of PET heated at 260 °C overnight, followed by cooling down to the room
temperature. The diffraction peaks are indexed to the crystalline PET with anorthic structure. c EDX
analysis of the crystallized PET, reproduced from Ref. [24], copyright 2019, with permission from
Elsevier
For instance, the PET material was heated in a resistance furnace at 260 °C,
which is above the melting point of PET, overnight. After cooling down to the room
temperature, white color large irregular-shaped crystalline particles were obtained,
which were subjected to XRD analysis. The pattern obtained is shown in Fig. 7.1b.
The diffraction peaks observed in the pattern are indexed according to those of PET
with an anorthic crystalline structure (JCPDS: 050-2275). In this pattern, the most
intense (100) reflection peak can be observed at 2θ value of 26.00°. The typical SEM
morphology of the crystalline PET obtained is exhibited as the inset in Fig. 7.1b, in
which a large particle with smooth surfaces and sharp edges can be observed [24].
Energy-dispersive X-ray analysis performed on the crystalline PET (Fig. 7.1c)
demonstrated a C:O atomic ratio of 1.8. This value is smaller than the theoretical
value of 2.5 which can be calculated for the repeat unit for PET. The C:O ratio of
the virgin and plasma-treated PET was measured to be 3 and 1.7, respectively using
XPS analysis [25]. In this case, the higher value of C:O measured on the virgin
PET, in comparison to the theoretical value, was attributed to the presence of surface
contaminations. Also, the lower value of C:O measured on the plasma-treated PET
was explained by the higher concentration of C–O and C=O bonds on the PET surface,
induced by the plasma treatment applied. In the above-discussed case, the lower value
of C:O atomic ratio measured using the EDX analysis was attributed to the surface
electron irradiation of PET occurred during the microscopy. The crystallization of
PET occurred during its solidification from melt could be realized from Fig. 7.1. It
111
Fig. 7.1 a XRD analysis of the raw PET water bottle material. The diffraction pattern observed
can be characterized by a broad peak cantered at the 2θ value of 25.4°, indicating the short-range
(100) crystalline domains with an anorthic configuration (C 10 H 8 O 4 , JCPDS card No. 050-2275).
b The XRD analysis of PET heated at 260 °C overnight, followed by cooling down to the room
temperature. The diffraction peaks are indexed to the crystalline PET with anorthic structure. c EDX
analysis of the crystallized PET, reproduced from Ref. [24], copyright 2019, with permission from
Elsevier
For instance, the PET material was heated in a resistance furnace at 260 °C,
which is above the melting point of PET, overnight. After cooling down to the room
temperature, white color large irregular-shaped crystalline particles were obtained,
which were subjected to XRD analysis. The pattern obtained is shown in Fig. 7.1b.
The diffraction peaks observed in the pattern are indexed according to those of PET
with an anorthic crystalline structure (JCPDS: 050-2275). In this pattern, the most
intense (100) reflection peak can be observed at 2θ value of 26.00°. The typical SEM
morphology of the crystalline PET obtained is exhibited as the inset in Fig. 7.1b, in
which a large particle with smooth surfaces and sharp edges can be observed [24].
Energy-dispersive X-ray analysis performed on the crystalline PET (Fig. 7.1c)
demonstrated a C:O atomic ratio of 1.8. This value is smaller than the theoretical
value of 2.5 which can be calculated for the repeat unit for PET. The C:O ratio of
the virgin and plasma-treated PET was measured to be 3 and 1.7, respectively using
XPS analysis [25]. In this case, the higher value of C:O measured on the virgin
PET, in comparison to the theoretical value, was attributed to the presence of surface
contaminations. Also, the lower value of C:O measured on the plasma-treated PET
was explained by the higher concentration of C–O and C=O bonds on the PET surface,
induced by the plasma treatment applied. In the above-discussed case, the lower value
of C:O atomic ratio measured using the EDX analysis was attributed to the surface
electron irradiation of PET occurred during the microscopy. The crystallization of
PET occurred during its solidification from melt could be realized from Fig. 7.1. It