

100
Routers
Links
Network
80
60
Energy consumption (μJ)
40
20
0
0.002
0.004
0.006
0.008
0.010
0.012
0.014
0.016
0.018
0.020
0.022
0.024
0.026
0.028
0.030
Offered load (packets/cycle/IP)
346
Network-on-Chip
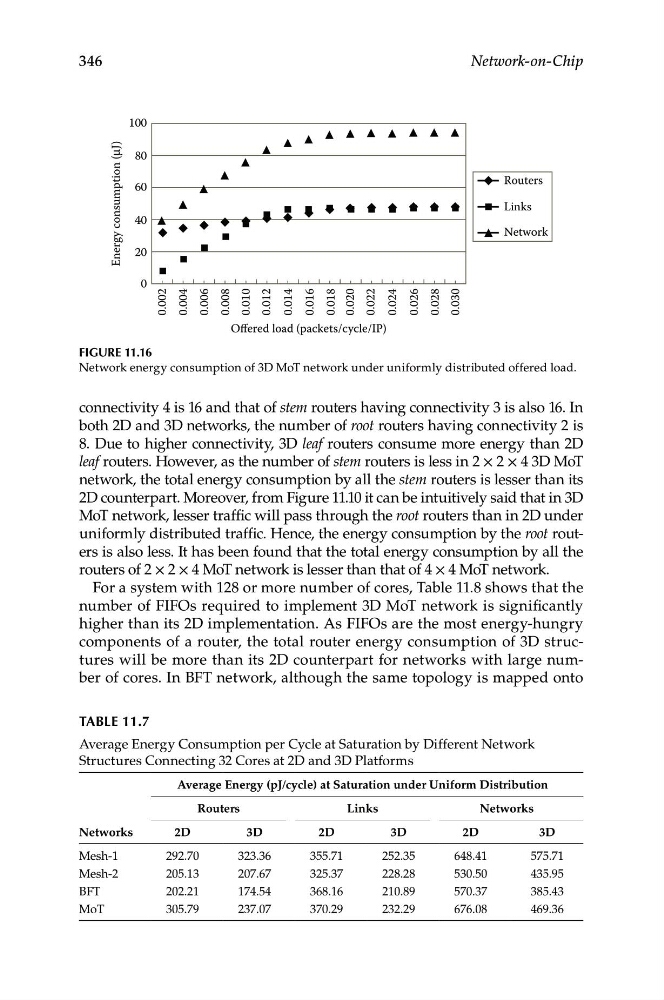
Figure 11.16
Network energy consumption of 3D MoT network under uniformly distributed offered load.
connectivity 4 is 16 and that of stem routers having connectivity 3 is also 16. In
both 2D and 3D networks, the number of root routers having connectivity 2 is
8. Due to higher connectivity, 3D leaf routers consume more energy than 2D
leaf routers. However, as the number of stem routers is less in 2 × 2 × 4 3D MoT
network, the total energy consumption by all the stem routers is lesser than its
2D counterpart. Moreover, from Figure 11.10 it can be intuitively said that in 3D
MoT network, lesser traffic will pass through the root routers than in 2D under
uniformly distributed traffic. Hence, the energy consumption by the root routers is also less. It has been found that the total energy consumption by all the
routers of 2 × 2 × 4 MoT network is lesser than that of 4 × 4 MoT network.
For a system with 128 or more number of cores, Table 11.8 shows that the
number of FIFOs required to implement 3D MoT network is significantly
higher than its 2D implementation. As FIFOs are the most energy-hungry
components of a router, the total router energy consumption of 3D structures will be more than its 2D counterpart for networks with large number of cores. In BFT network, although the same topology is mapped onto
TABLe 11.7
Average Energy Consumption per Cycle at Saturation by Different Network
Structures Connecting 32 Cores at 2D and 3D Platforms
Average Energy (pJ/cycle) at Saturation under Uniform Distribution
Routers
Links
Networks
Networks
2D
3D
2D
3D
2D
3D
Mesh-1
292.70
323.36
355.71
252.35
648.41
575.71
Mesh-2
205.13
207.67
325.37
228.28
530.50
435.95
BFT
202.21
174.54
368.16
210.89
570.37
385.43
MoT
305.79
237.07
370.29
232.29
676.08
469.36