

SelfCoupling
SelfMutual
Capacitance
Capacitance
Inductance
Inductance
Resistance
(pF/m)
(pF/m)
(µH/m)
(µH/m)
(kΩ/m)
Line 1
134.54
Lines 1–2
70.33
Line 1
0.33
Lines 1–2
0.17
Line 1
137.93
Line 2
175.92
Lines 2–3
70.33
Line 2
0.32
Lines 2–3
0.17
Line 2
137.93
Line 3
134.54
Lines 1–3
1.99
Line 3
0.33
Lines 1–3
0.09
Line 3
137.93
81
Evaluation of Network-on-Chip Architectures
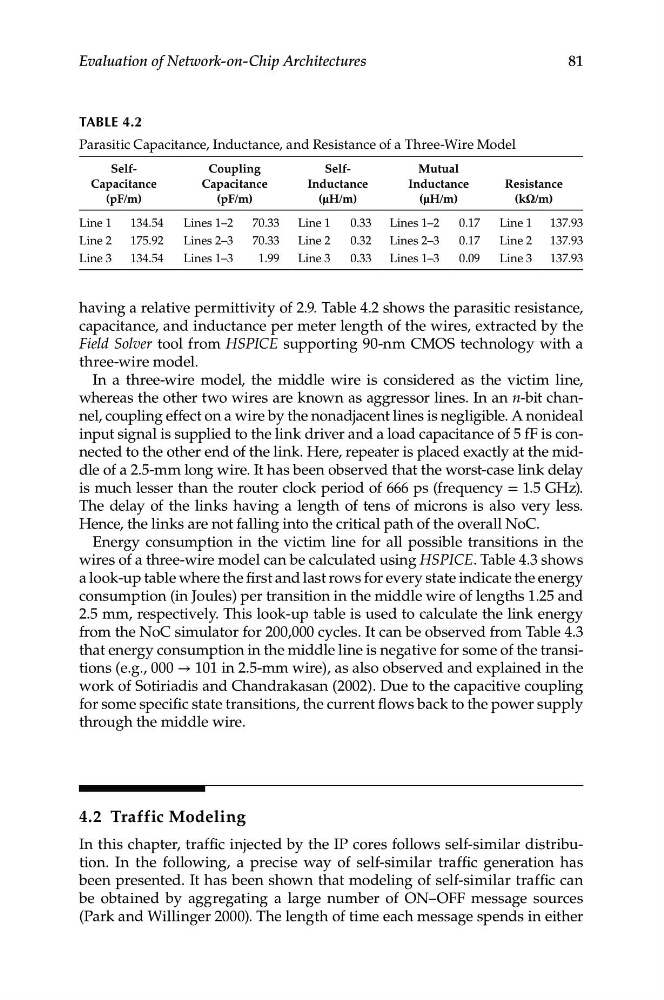
TABLe 4.2
Parasitic Capacitance, Inductance, and Resistance of a Three-Wire Model
having a relative permittivity of 2.9. Table 4.2 shows the parasitic resistance,
capacitance, and inductance per meter length of the wires, extracted by the
Field Solver tool from HSPICE supporting 90-nm CMOS technology with a
three-wire model.
In a three-wire model, the middle wire is considered as the victim line,
whereas the other two wires are known as aggressor lines. In an n-bit channel, coupling effect on a wire by the nonadjacent lines is negligible. A nonideal
input signal is supplied to the link driver and a load capacitance of 5 fF is connected to the other end of the link. Here, repeater is placed exactly at the middle of a 2.5-mm long wire. It has been observed that the worst-case link delay
is much lesser than the router clock period of 666 ps (frequency = 1.5 GHz).
The delay of the links having a length of tens of microns is also very less.
Hence, the links are not falling into the critical path of the overall NoC.
Energy consumption in the victim line for all possible transitions in the
wires of a three-wire model can be calculated using HSPICE. Table 4.3 shows
a look-up table where the first and last rows for every state indicate the energy
consumption (in Joules) per transition in the middle wire of lengths 1.25 and
2.5 mm, respectively. This look-up table is used to calculate the link energy
from the NoC simulator for 200,000 cycles. It can be observed from Table 4.3
that energy consumption in the middle line is negative for some of the transitions (e.g., 000 → 101 in 2.5-mm wire), as also observed and explained in the
work of Sotiriadis and Chandrakasan (2002). Due to the capacitive coupling
for some specific state transitions, the current flows back to the power supply
through the middle wire.
4.2 Traffic Modeling
In this chapter, traffic injected by the IP cores follows self-similar distribution. In the following, a precise way of self-similar traffic generation has
been presented. It has been shown that modeling of self-similar traffic can
be obtained by aggregating a large number of ON–OFF message sources
(Park and Willinger 2000). The length of time each message spends in either