

Nucleic Acid Based Nanoconstructs for Environmental Analysis …
589
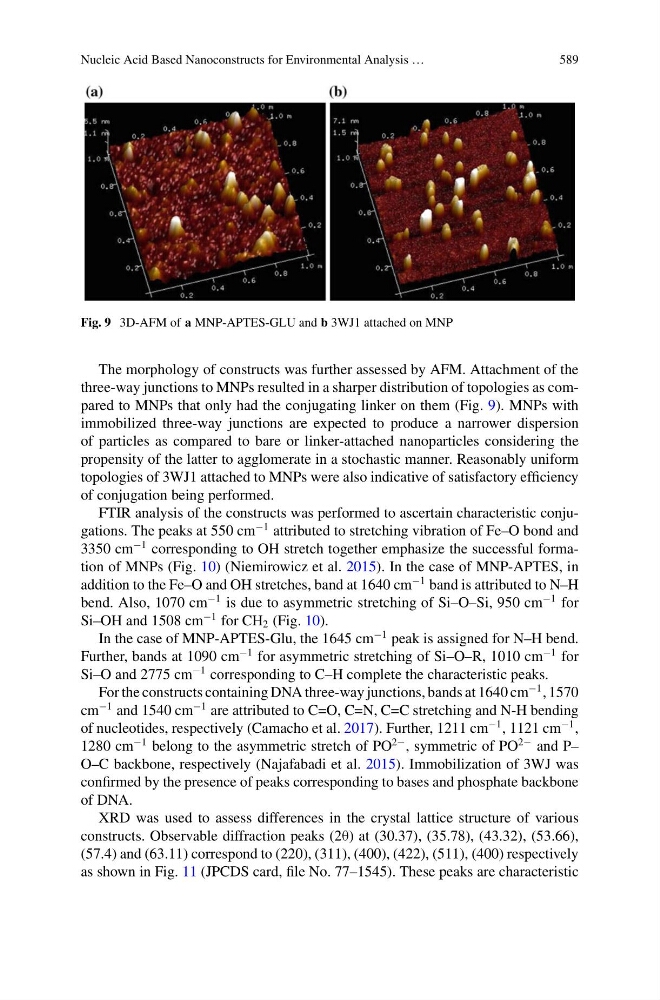
Fig. 9 3D-AFM of a MNP-APTES-GLU and b 3WJ1 attached on MNP
The morphology of constructs was further assessed by AFM. Attachment of the
three-way junctions to MNPs resulted in a sharper distribution of topologies as compared to MNPs that only had the conjugating linker on them (Fig. 9). MNPs with
immobilized three-way junctions are expected to produce a narrower dispersion
of particles as compared to bare or linker-attached nanoparticles considering the
propensity of the latter to agglomerate in a stochastic manner. Reasonably uniform
topologies of 3WJ1 attached to MNPs were also indicative of satisfactory efficiency
of conjugation being performed.
FTIR analysis of the constructs was performed to ascertain characteristic conjugations. The peaks at 550 cm
−1 attributed to stretching vibration of Fe–O bond and
3350 cm
−1 corresponding to OH stretch together emphasize the successful formation of MNPs (Fig. 10) (Niemirowicz et al. 2015). In the case of MNP-APTES, in
addition to the Fe–O and OH stretches, band at 1640 cm
−1 band is attributed to N–H
bend. Also, 1070 cm
−1 is due to asymmetric stretching of Si–O–Si, 950 cm
−1 for
Si–OH and 1508 cm
−1 for CH 2 (Fig. 10).
In the case of MNP-APTES-Glu, the 1645 cm
−1 peak is assigned for N–H bend.
Further, bands at 1090 cm
−1 for asymmetric stretching of Si–O–R, 1010 cm
−1 for
Si–O and 2775 cm
−1 corresponding to C–H complete the characteristic peaks.
For the constructs containing DNA three-way junctions, bands at 1640 cm
−1 , 1570
cm
−1 and 1540 cm
−1 are attributed to C=O, C=N, C=C stretching and N-H bending
of nucleotides, respectively (Camacho et al. 2017). Further, 1211 cm
−1 , 1121 cm
−1 ,
1280 cm
−1 belong to the asymmetric stretch of PO
2− , symmetric of PO
2− and P–
O–C backbone, respectively (Najafabadi et al. 2015). Immobilization of 3WJ was
confirmed by the presence of peaks corresponding to bases and phosphate backbone
of DNA.
XRD was used to assess differences in the crystal lattice structure of various
constructs. Observable diffraction peaks (2θ) at (30.37), (35.78), (43.32), (53.66),
(57.4) and (63.11) correspond to (220), (311), (400), (422), (511), (400) respectively
as shown in Fig. 11 (JPCDS card, file No. 77–1545). These peaks are characteristic