

522
P. S. Das et al.
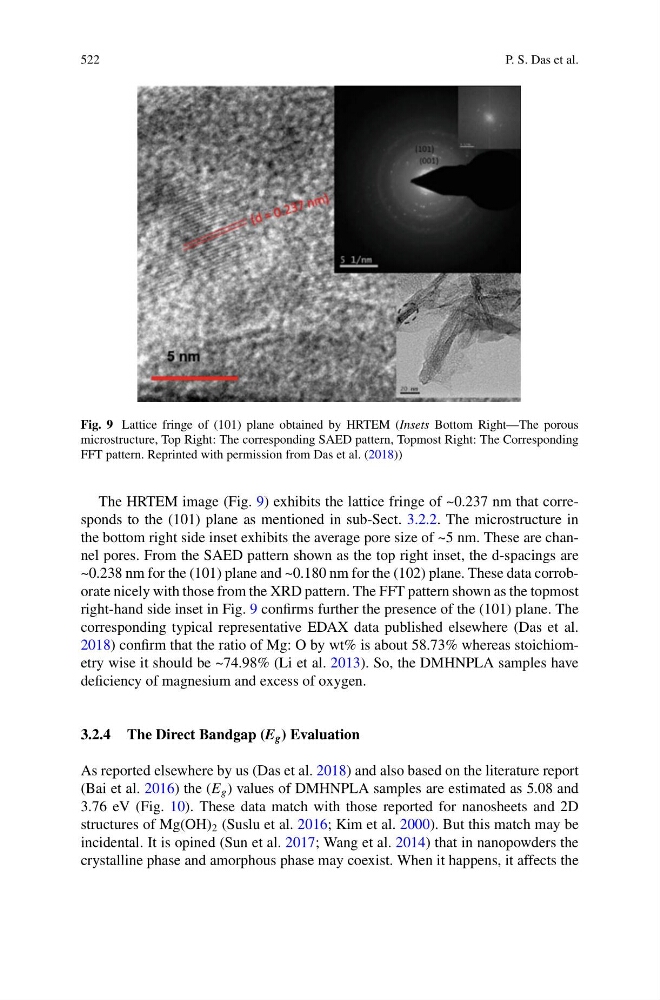
Fig. 9 Lattice fringe of (101) plane obtained by HRTEM (Insets Bottom Right—The porous
microstructure, Top Right: The corresponding SAED pattern, Topmost Right: The Corresponding
FFT pattern. Reprinted with permission from Das et al. (2018))
The HRTEM image (Fig. 9) exhibits the lattice fringe of ~0.237 nm that corresponds to the (101) plane as mentioned in sub-Sect. 3.2.2. The microstructure in
the bottom right side inset exhibits the average pore size of ~5 nm. These are channel pores. From the SAED pattern shown as the top right inset, the d-spacings are
~0.238 nm for the (101) plane and ~0.180 nm for the (102) plane. These data corroborate nicely with those from the XRD pattern. The FFT pattern shown as the topmost
right-hand side inset in Fig. 9 confirms further the presence of the (101) plane. The
corresponding typical representative EDAX data published elsewhere (Das et al.
2018) confirm that the ratio of Mg: O by wt% is about 58.73% whereas stoichiometry wise it should be ~74.98% (Li et al. 2013). So, the DMHNPLA samples have
deficiency of magnesium and excess of oxygen.
3.2.4 The Direct Bandgap (E g ) Evaluation
As reported elsewhere by us (Das et al. 2018) and also based on the literature report
(Bai et al. 2016) the (E g ) values of DMHNPLA samples are estimated as 5.08 and
3.76 eV (Fig. 10). These data match with those reported for nanosheets and 2D
structures of Mg(OH) 2 (Suslu et al. 2016; Kim et al. 2000). But this match may be
incidental. It is opined (Sun et al. 2017; Wang et al. 2014) that in nanopowders the
crystalline phase and amorphous phase may coexist. When it happens, it affects the
P. S. Das et al.
Fig. 9 Lattice fringe of (101) plane obtained by HRTEM (Insets Bottom Right—The porous
microstructure, Top Right: The corresponding SAED pattern, Topmost Right: The Corresponding
FFT pattern. Reprinted with permission from Das et al. (2018))
The HRTEM image (Fig. 9) exhibits the lattice fringe of ~0.237 nm that corresponds to the (101) plane as mentioned in sub-Sect. 3.2.2. The microstructure in
the bottom right side inset exhibits the average pore size of ~5 nm. These are channel pores. From the SAED pattern shown as the top right inset, the d-spacings are
~0.238 nm for the (101) plane and ~0.180 nm for the (102) plane. These data corroborate nicely with those from the XRD pattern. The FFT pattern shown as the topmost
right-hand side inset in Fig. 9 confirms further the presence of the (101) plane. The
corresponding typical representative EDAX data published elsewhere (Das et al.
2018) confirm that the ratio of Mg: O by wt% is about 58.73% whereas stoichiometry wise it should be ~74.98% (Li et al. 2013). So, the DMHNPLA samples have
deficiency of magnesium and excess of oxygen.
3.2.4 The Direct Bandgap (E g ) Evaluation
As reported elsewhere by us (Das et al. 2018) and also based on the literature report
(Bai et al. 2016) the (E g ) values of DMHNPLA samples are estimated as 5.08 and
3.76 eV (Fig. 10). These data match with those reported for nanosheets and 2D
structures of Mg(OH) 2 (Suslu et al. 2016; Kim et al. 2000). But this match may be
incidental. It is opined (Sun et al. 2017; Wang et al. 2014) that in nanopowders the
crystalline phase and amorphous phase may coexist. When it happens, it affects the