

516
P. S. Das et al.
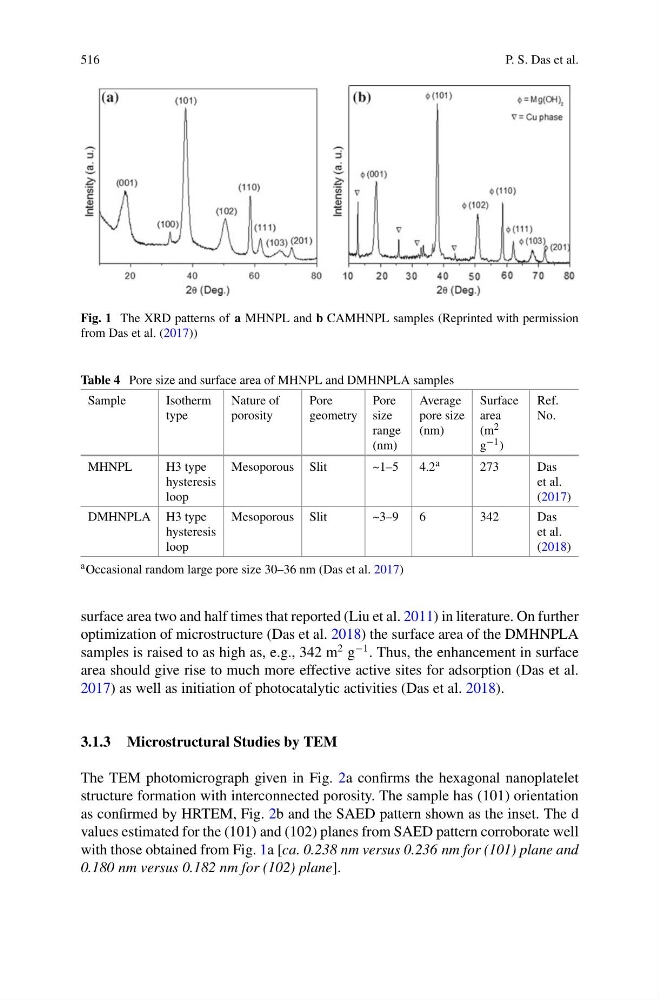
Fig. 1 The XRD patterns of a MHNPL and b CAMHNPL samples (Reprinted with permission
from Das et al. (2017))
Table 4 Pore size and surface area of MHNPL and DMHNPLA samples
Sample
Isotherm
type
Nature of
porosity
Pore
geometry
Pore
size
range
(nm)
Average
pore size
(nm)
Surface
area
(m 2
g −1 )
Ref.
No.
MHNPL
H3 type
hysteresis
loop
Mesoporous Slit
~1–5
4.2 a
273
Das
et al.
(2017)
DMHNPLA H3 type
hysteresis
loop
Mesoporous Slit
~3–9
6
342
Das
et al.
(2018)
a Occasional random large pore size 30–36 nm (Das et al. 2017)
surface area two and half times that reported (Liu et al. 2011) in literature. On further
optimization of microstructure (Das et al. 2018) the surface area of the DMHNPLA
samples is raised to as high as, e.g., 342 m
2 g
−1 . Thus, the enhancement in surface
area should give rise to much more effective active sites for adsorption (Das et al.
2017) as well as initiation of photocatalytic activities (Das et al. 2018).
3.1.3 Microstructural Studies by TEM
The TEM photomicrograph given in Fig. 2a confirms the hexagonal nanoplatelet
structure formation with interconnected porosity. The sample has (101) orientation
as confirmed by HRTEM, Fig. 2b and the SAED pattern shown as the inset. The d
values estimated for the (101) and (102) planes from SAED pattern corroborate well
with those obtained from Fig. 1a [ca. 0.238 nm versus 0.236 nm for (101) plane and
0.180 nm versus 0.182 nm for (102) plane].
P. S. Das et al.
Fig. 1 The XRD patterns of a MHNPL and b CAMHNPL samples (Reprinted with permission
from Das et al. (2017))
Table 4 Pore size and surface area of MHNPL and DMHNPLA samples
Sample
Isotherm
type
Nature of
porosity
Pore
geometry
Pore
size
range
(nm)
Average
pore size
(nm)
Surface
area
(m 2
g −1 )
Ref.
No.
MHNPL
H3 type
hysteresis
loop
Mesoporous Slit
~1–5
4.2 a
273
Das
et al.
(2017)
DMHNPLA H3 type
hysteresis
loop
Mesoporous Slit
~3–9
6
342
Das
et al.
(2018)
a Occasional random large pore size 30–36 nm (Das et al. 2017)
surface area two and half times that reported (Liu et al. 2011) in literature. On further
optimization of microstructure (Das et al. 2018) the surface area of the DMHNPLA
samples is raised to as high as, e.g., 342 m
2 g
−1 . Thus, the enhancement in surface
area should give rise to much more effective active sites for adsorption (Das et al.
2017) as well as initiation of photocatalytic activities (Das et al. 2018).
3.1.3 Microstructural Studies by TEM
The TEM photomicrograph given in Fig. 2a confirms the hexagonal nanoplatelet
structure formation with interconnected porosity. The sample has (101) orientation
as confirmed by HRTEM, Fig. 2b and the SAED pattern shown as the inset. The d
values estimated for the (101) and (102) planes from SAED pattern corroborate well
with those obtained from Fig. 1a [ca. 0.238 nm versus 0.236 nm for (101) plane and
0.180 nm versus 0.182 nm for (102) plane].