

Optimization of MAPbI 3 Film Using Response …
409
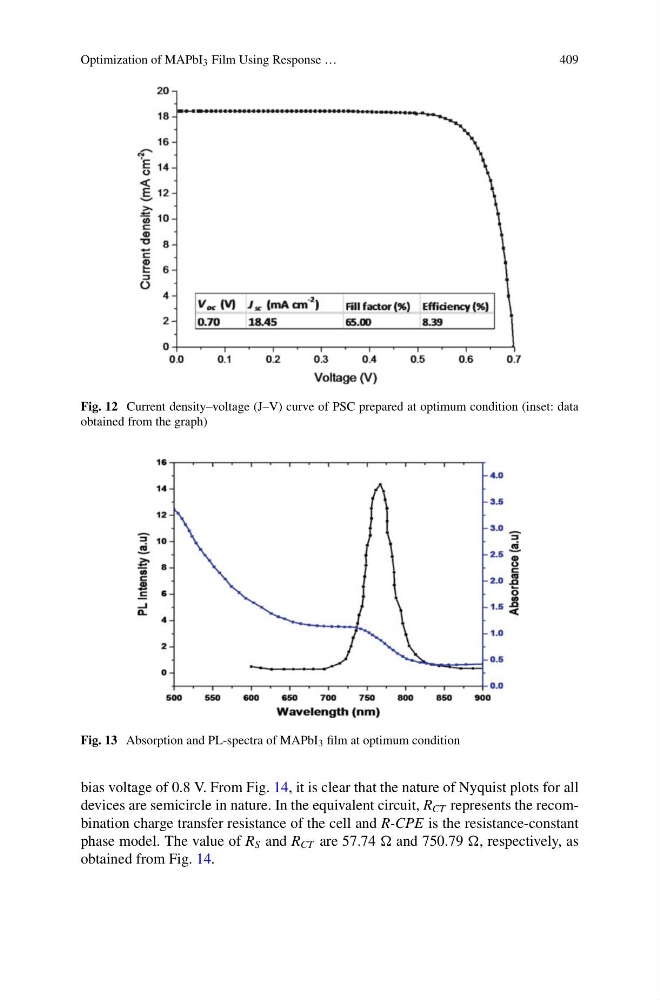
Fig. 12 Current density–voltage (J–V) curve of PSC prepared at optimum condition (inset: data
obtained from the graph)
Fig. 13 Absorption and PL-spectra of MAPbI 3 film at optimum condition
bias voltage of 0.8 V. From Fig. 14, it is clear that the nature of Nyquist plots for all
devices are semicircle in nature. In the equivalent circuit, R CT represents the recombination charge transfer resistance of the cell and R-CPE is the resistance-constant
phase model. The value of R S and R CT are 57.74 and 750.79 , respectively, as
obtained from Fig. 14.
409
Fig. 12 Current density–voltage (J–V) curve of PSC prepared at optimum condition (inset: data
obtained from the graph)
Fig. 13 Absorption and PL-spectra of MAPbI 3 film at optimum condition
bias voltage of 0.8 V. From Fig. 14, it is clear that the nature of Nyquist plots for all
devices are semicircle in nature. In the equivalent circuit, R CT represents the recombination charge transfer resistance of the cell and R-CPE is the resistance-constant
phase model. The value of R S and R CT are 57.74 and 750.79 , respectively, as
obtained from Fig. 14.