

408
N. Kumari et al.
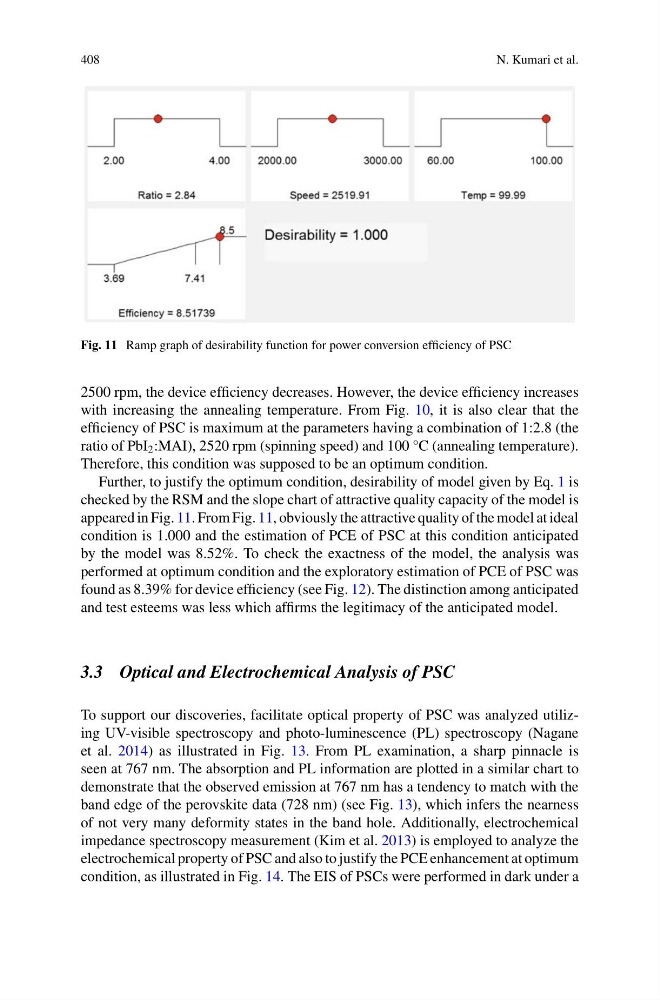
Fig. 11 Ramp graph of desirability function for power conversion efficiency of PSC
2500 rpm, the device efficiency decreases. However, the device efficiency increases
with increasing the annealing temperature. From Fig. 10, it is also clear that the
efficiency of PSC is maximum at the parameters having a combination of 1:2.8 (the
ratio of PbI 2 :MAI), 2520 rpm (spinning speed) and 100 °C (annealing temperature).
Therefore, this condition was supposed to be an optimum condition.
Further, to justify the optimum condition, desirability of model given by Eq. 1 is
checked by the RSM and the slope chart of attractive quality capacity of the model is
appeared in Fig. 11. From Fig. 11, obviously the attractive quality of the model at ideal
condition is 1.000 and the estimation of PCE of PSC at this condition anticipated
by the model was 8.52%. To check the exactness of the model, the analysis was
performed at optimum condition and the exploratory estimation of PCE of PSC was
found as 8.39% for device efficiency (see Fig. 12). The distinction among anticipated
and test esteems was less which affirms the legitimacy of the anticipated model.
3.3 Optical and Electrochemical Analysis of PSC
To support our discoveries, facilitate optical property of PSC was analyzed utilizing UV-visible spectroscopy and photo-luminescence (PL) spectroscopy (Nagane
et al. 2014) as illustrated in Fig. 13. From PL examination, a sharp pinnacle is
seen at 767 nm. The absorption and PL information are plotted in a similar chart to
demonstrate that the observed emission at 767 nm has a tendency to match with the
band edge of the perovskite data (728 nm) (see Fig. 13), which infers the nearness
of not very many deformity states in the band hole. Additionally, electrochemical
impedance spectroscopy measurement (Kim et al. 2013) is employed to analyze the
electrochemical property of PSC and also to justify the PCE enhancement at optimum
condition, as illustrated in Fig. 14. The EIS of PSCs were performed in dark under a
N. Kumari et al.
Fig. 11 Ramp graph of desirability function for power conversion efficiency of PSC
2500 rpm, the device efficiency decreases. However, the device efficiency increases
with increasing the annealing temperature. From Fig. 10, it is also clear that the
efficiency of PSC is maximum at the parameters having a combination of 1:2.8 (the
ratio of PbI 2 :MAI), 2520 rpm (spinning speed) and 100 °C (annealing temperature).
Therefore, this condition was supposed to be an optimum condition.
Further, to justify the optimum condition, desirability of model given by Eq. 1 is
checked by the RSM and the slope chart of attractive quality capacity of the model is
appeared in Fig. 11. From Fig. 11, obviously the attractive quality of the model at ideal
condition is 1.000 and the estimation of PCE of PSC at this condition anticipated
by the model was 8.52%. To check the exactness of the model, the analysis was
performed at optimum condition and the exploratory estimation of PCE of PSC was
found as 8.39% for device efficiency (see Fig. 12). The distinction among anticipated
and test esteems was less which affirms the legitimacy of the anticipated model.
3.3 Optical and Electrochemical Analysis of PSC
To support our discoveries, facilitate optical property of PSC was analyzed utilizing UV-visible spectroscopy and photo-luminescence (PL) spectroscopy (Nagane
et al. 2014) as illustrated in Fig. 13. From PL examination, a sharp pinnacle is
seen at 767 nm. The absorption and PL information are plotted in a similar chart to
demonstrate that the observed emission at 767 nm has a tendency to match with the
band edge of the perovskite data (728 nm) (see Fig. 13), which infers the nearness
of not very many deformity states in the band hole. Additionally, electrochemical
impedance spectroscopy measurement (Kim et al. 2013) is employed to analyze the
electrochemical property of PSC and also to justify the PCE enhancement at optimum
condition, as illustrated in Fig. 14. The EIS of PSCs were performed in dark under a