

406
N. Kumari et al.
Table 6 Analysis of variance (ANOVA) for the fitted quadratic polynomial model
Sources
RC
f-value
p-value
Model
7.34
1645.34
<0.0001
Significant
X 1
−0.53
1123.60
<0.0001
X 2
−0.27
302.50
<0.0001
X 3
1.02
4202.50
<0.0001
X 2
1
−0.005
5542.12
<0.0001
X 2
2
0.055
3146.33
<0.0001
X 2
3
0.095
34.22
0.0006
X 1 X 2
−1.62
0.050
0.8294
X 1 X 3
−1.22
6.05
0.0435
X 2 X 3
0.12
18.05
0.0038
Lack of fit
–
5.85
0.0605
Not significant
R 2
0.9995
Adj. R 2
0.9989
Pred. R 2
0.9937
RC: regression coefficient
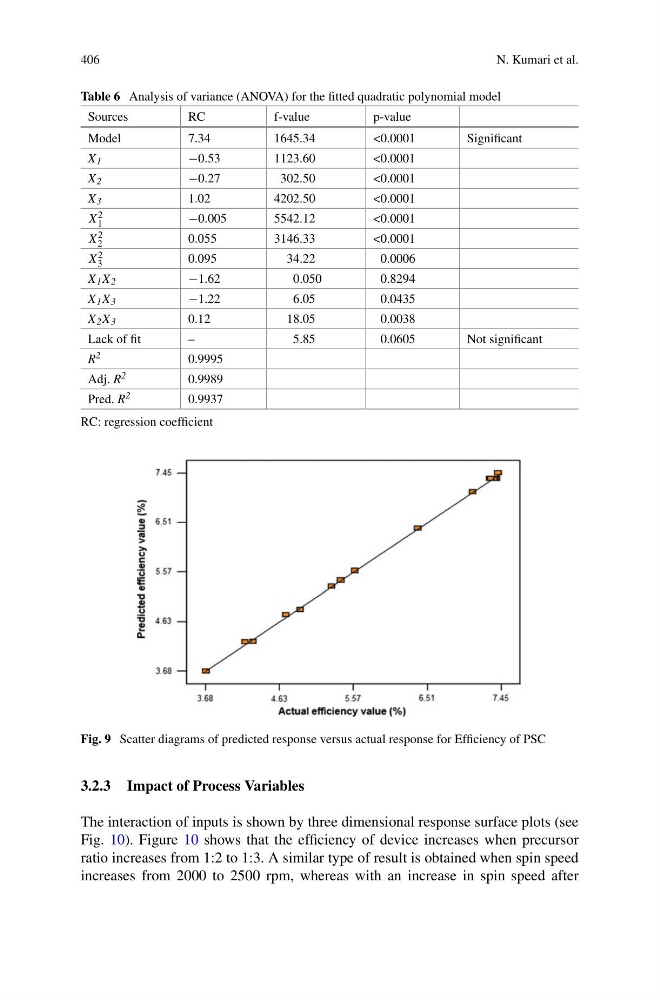
Fig. 9 Scatter diagrams of predicted response versus actual response for Efficiency of PSC
3.2.3 Impact of Process Variables
The interaction of inputs is shown by three dimensional response surface plots (see
Fig. 10). Figure 10 shows that the efficiency of device increases when precursor
ratio increases from 1:2 to 1:3. A similar type of result is obtained when spin speed
increases from 2000 to 2500 rpm, whereas with an increase in spin speed after
N. Kumari et al.
Table 6 Analysis of variance (ANOVA) for the fitted quadratic polynomial model
Sources
RC
f-value
p-value
Model
7.34
1645.34
<0.0001
Significant
X 1
−0.53
1123.60
<0.0001
X 2
−0.27
302.50
<0.0001
X 3
1.02
4202.50
<0.0001
X 2
1
−0.005
5542.12
<0.0001
X 2
2
0.055
3146.33
<0.0001
X 2
3
0.095
34.22
0.0006
X 1 X 2
−1.62
0.050
0.8294
X 1 X 3
−1.22
6.05
0.0435
X 2 X 3
0.12
18.05
0.0038
Lack of fit
–
5.85
0.0605
Not significant
R 2
0.9995
Adj. R 2
0.9989
Pred. R 2
0.9937
RC: regression coefficient
Fig. 9 Scatter diagrams of predicted response versus actual response for Efficiency of PSC
3.2.3 Impact of Process Variables
The interaction of inputs is shown by three dimensional response surface plots (see
Fig. 10). Figure 10 shows that the efficiency of device increases when precursor
ratio increases from 1:2 to 1:3. A similar type of result is obtained when spin speed
increases from 2000 to 2500 rpm, whereas with an increase in spin speed after