

Agents in Biology
199
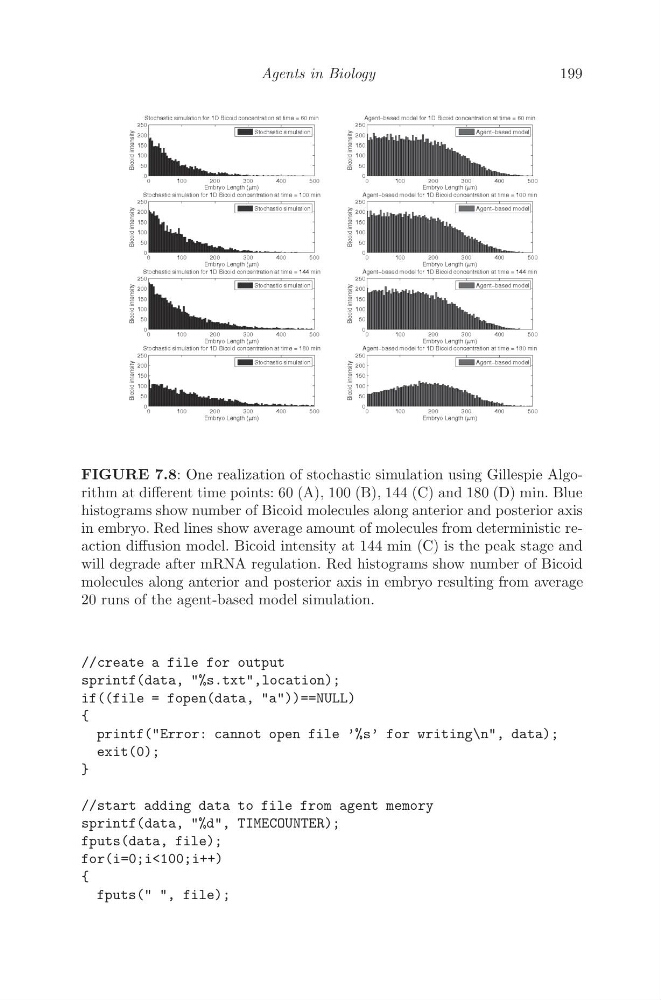
FIGURE 7.8: One realization of stochastic simulation using Gillespie Algorithm at different time points: 60 (A), 100 (B), 144 (C) and 180 (D) min. Blue
histograms show number of Bicoid molecules along anterior and posterior axis
in embryo. Red lines show average amount of molecules from deterministic reaction diffusion model. Bicoid intensity at 144 min (C) is the peak stage and
will degrade after mRNA regulation. Red histograms show number of Bicoid
molecules along anterior and posterior axis in embryo resulting from average
20 runs of the agent-based model simulation.
//create a file for output
sprintf(data, "%s.txt",location);
if((file = fopen(data, "a"))==NULL)
{
printf("Error: cannot open file ’%s’ for writing\n", data);
exit(0);
}
//start adding data to file from agent memory
sprintf(data, "%d", TIMECOUNTER);
fputs(data, file);
for(i=0;i<100;i++)
{
fputs(" ", file);
199
FIGURE 7.8: One realization of stochastic simulation using Gillespie Algorithm at different time points: 60 (A), 100 (B), 144 (C) and 180 (D) min. Blue
histograms show number of Bicoid molecules along anterior and posterior axis
in embryo. Red lines show average amount of molecules from deterministic reaction diffusion model. Bicoid intensity at 144 min (C) is the peak stage and
will degrade after mRNA regulation. Red histograms show number of Bicoid
molecules along anterior and posterior axis in embryo resulting from average
20 runs of the agent-based model simulation.
//create a file for output
sprintf(data, "%s.txt",location);
if((file = fopen(data, "a"))==NULL)
{
printf("Error: cannot open file ’%s’ for writing\n", data);
exit(0);
}
//start adding data to file from agent memory
sprintf(data, "%d", TIMECOUNTER);
fputs(data, file);
for(i=0;i<100;i++)
{
fputs(" ", file);