

198
X-Machines for Agent-Based Modeling: FLAME Perspectives
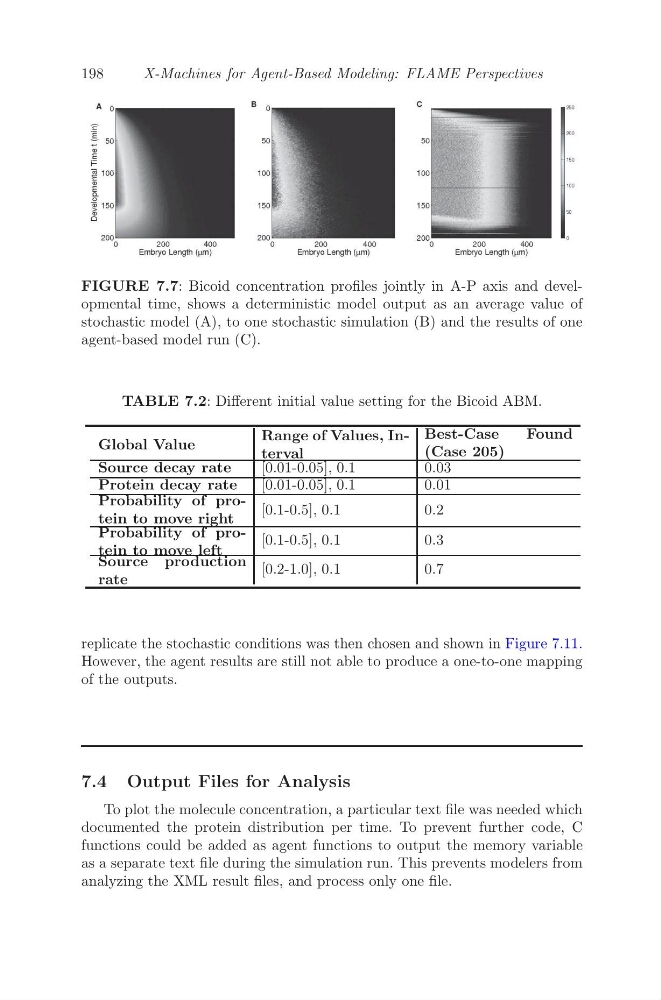
FIGURE 7.7: Bicoid concentration profiles jointly in A-P axis and developmental time, shows a deterministic model output as an average value of
stochastic model (A), to one stochastic simulation (B) and the results of one
agent-based model run (C).
TABLE 7.2: Different initial value setting for the Bicoid ABM.
Global Value
Range of Values, Interval
Best-Case
Found
(Case 205)
Source decay rate
[0.01-0.05], 0.1
0.03
Protein decay rate
[0.01-0.05], 0.1
0.01
Probability of protein to move right
[0.1-0.5], 0.1
0.2
Probability of protein to move left
[0.1-0.5], 0.1
0.3
Source production
rate
[0.2-1.0], 0.1
0.7
replicate the stochastic conditions was then chosen and shown in Figure 7.11.
However, the agent results are still not able to produce a one-to-one mapping
of the outputs.
7.4 Output Files for Analysis
To plot the molecule concentration, a particular text file was needed which
documented the protein distribution per time. To prevent further code, C
functions could be added as agent functions to output the memory variable
as a separate text file during the simulation run. This prevents modelers from
analyzing the XML result files, and process only one file.
X-Machines for Agent-Based Modeling: FLAME Perspectives
FIGURE 7.7: Bicoid concentration profiles jointly in A-P axis and developmental time, shows a deterministic model output as an average value of
stochastic model (A), to one stochastic simulation (B) and the results of one
agent-based model run (C).
TABLE 7.2: Different initial value setting for the Bicoid ABM.
Global Value
Range of Values, Interval
Best-Case
Found
(Case 205)
Source decay rate
[0.01-0.05], 0.1
0.03
Protein decay rate
[0.01-0.05], 0.1
0.01
Probability of protein to move right
[0.1-0.5], 0.1
0.2
Probability of protein to move left
[0.1-0.5], 0.1
0.3
Source production
rate
[0.2-1.0], 0.1
0.7
replicate the stochastic conditions was then chosen and shown in Figure 7.11.
However, the agent results are still not able to produce a one-to-one mapping
of the outputs.
7.4 Output Files for Analysis
To plot the molecule concentration, a particular text file was needed which
documented the protein distribution per time. To prevent further code, C
functions could be added as agent functions to output the memory variable
as a separate text file during the simulation run. This prevents modelers from
analyzing the XML result files, and process only one file.