

132
X-Machines for Agent-Based Modeling: FLAME Perspectives
F i r m
( F o r a l l f i r m s )
S y s t e m
( A c t s a s t h e e n v i r o n m e n t )
C h o o s e a p a r t i c u l a r
o u t p u t t o p r o d u c e u s i n g
o n e o f t h e e v o l u t i o n a r y
a l g o r i t h m s
S e n d t h e o u t p u t
p r o d u c e d o u t t o
o t h e r f i r m s
R e a d i n a l l t h e
o u t p u t s p r o d u c e d b y
a l l f i r m s
W o r k o u t t h e p r i c e
o f t h e p r o d u c t , u s i n g t h e t o t a l o u t p u t
a n d d e m a n d i n t h e s y s t e m
S e n d o u t t h e c a l c u l a t e d p r i c e
o f t h e p r o d u c t t o a l l f i r m s
R e a d i n t h e p r i c e
o f t h e p r o d u c t
C a l c u l a t e t h e p r o f i t a c h i e v e d
o n t h e o u t p u t p r o d u c e d i n t h e
b e g i n n i n g o f s i m u l a t i o n
F u n c t i o n s d u r i n g
o n e t i m e s t e p
S t a r t i n g p o i n t i n a n i t e r a t i o n
S t o p p i n g p o i n t i n a n i t e r a t i o n
f i r m o u t p u t
m e s s a g e s
p r i c e
m e s s a g e s
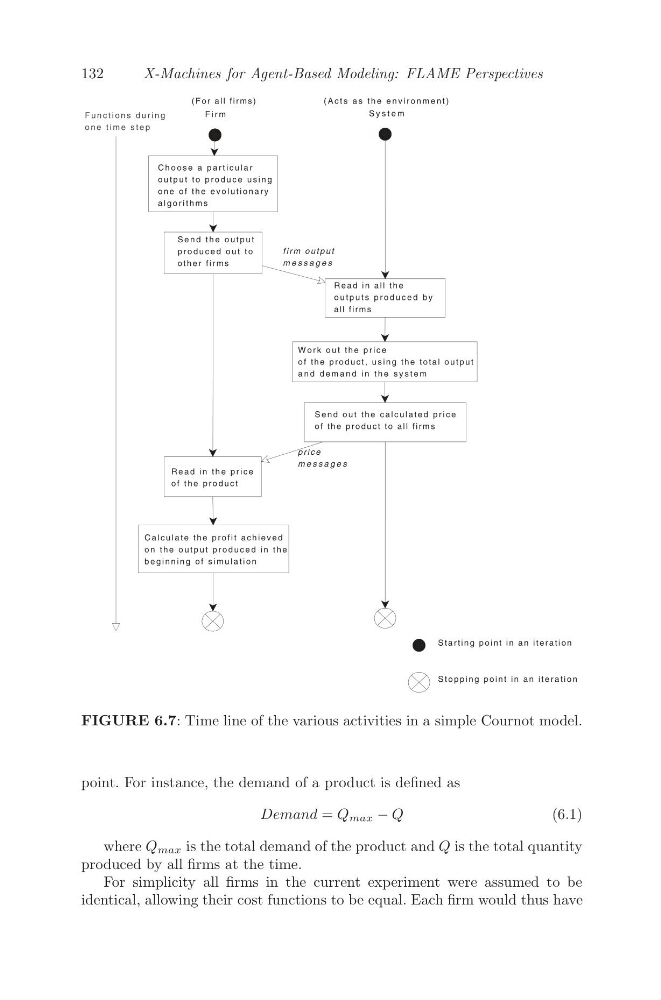
FIGURE 6.7: Time line of the various activities in a simple Cournot model.
point. For instance, the demand of a product is defined as
Demand = Q max − Q
(6.1)
where Q max is the total demand of the product and Q is the total quantity
produced by all firms at the time.
For simplicity all firms in the current experiment were assumed to be
identical, allowing their cost functions to be equal. Each firm would thus have
X-Machines for Agent-Based Modeling: FLAME Perspectives
F i r m
( F o r a l l f i r m s )
S y s t e m
( A c t s a s t h e e n v i r o n m e n t )
C h o o s e a p a r t i c u l a r
o u t p u t t o p r o d u c e u s i n g
o n e o f t h e e v o l u t i o n a r y
a l g o r i t h m s
S e n d t h e o u t p u t
p r o d u c e d o u t t o
o t h e r f i r m s
R e a d i n a l l t h e
o u t p u t s p r o d u c e d b y
a l l f i r m s
W o r k o u t t h e p r i c e
o f t h e p r o d u c t , u s i n g t h e t o t a l o u t p u t
a n d d e m a n d i n t h e s y s t e m
S e n d o u t t h e c a l c u l a t e d p r i c e
o f t h e p r o d u c t t o a l l f i r m s
R e a d i n t h e p r i c e
o f t h e p r o d u c t
C a l c u l a t e t h e p r o f i t a c h i e v e d
o n t h e o u t p u t p r o d u c e d i n t h e
b e g i n n i n g o f s i m u l a t i o n
F u n c t i o n s d u r i n g
o n e t i m e s t e p
S t a r t i n g p o i n t i n a n i t e r a t i o n
S t o p p i n g p o i n t i n a n i t e r a t i o n
f i r m o u t p u t
m e s s a g e s
p r i c e
m e s s a g e s
FIGURE 6.7: Time line of the various activities in a simple Cournot model.
point. For instance, the demand of a product is defined as
Demand = Q max − Q
(6.1)
where Q max is the total demand of the product and Q is the total quantity
produced by all firms at the time.
For simplicity all firms in the current experiment were assumed to be
identical, allowing their cost functions to be equal. Each firm would thus have