

106
X-Machines for Agent-Based Modeling: FLAME Perspectives
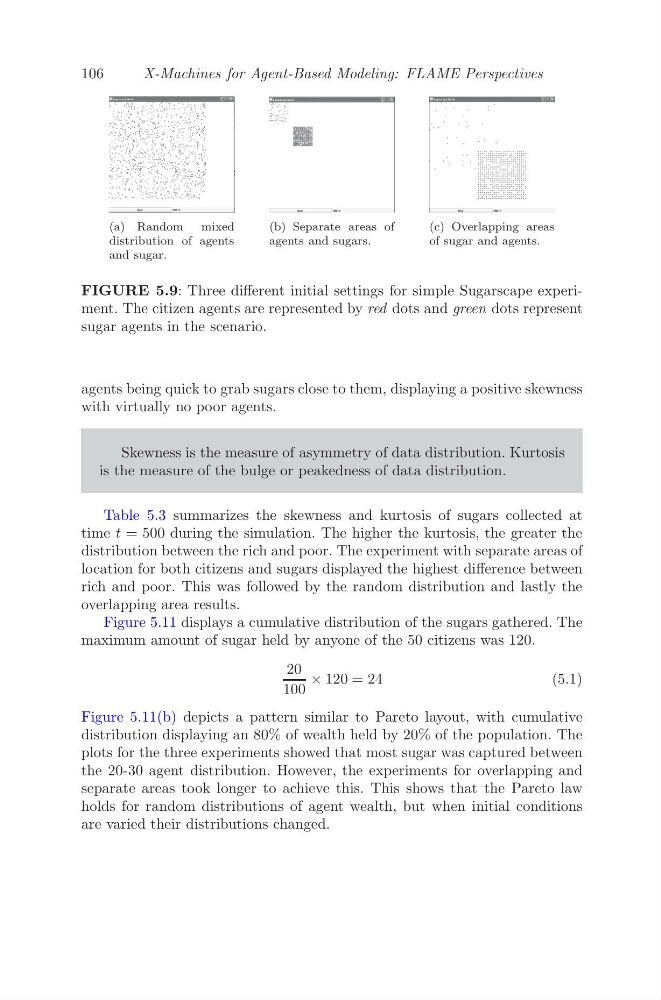
(a) Random mixed
distribution of agents
and sugar.
(b) Separate areas of
agents and sugars.
(c) Overlapping areas
of sugar and agents.
FIGURE 5.9: Three different initial settings for simple Sugarscape experiment. The citizen agents are represented by red dots and green dots represent
sugar agents in the scenario.
agents being quick to grab sugars close to them, displaying a positive skewness
with virtually no poor agents.
Skewness is the measure of asymmetry of data distribution. Kurtosis
is the measure of the bulge or peakedness of data distribution.
Table 5.3 summarizes the skewness and kurtosis of sugars collected at
time t = 500 during the simulation. The higher the kurtosis, the greater the
distribution between the rich and poor. The experiment with separate areas of
location for both citizens and sugars displayed the highest difference between
rich and poor. This was followed by the random distribution and lastly the
overlapping area results.
Figure 5.11 displays a cumulative distribution of the sugars gathered. The
maximum amount of sugar held by anyone of the 50 citizens was 120.
20
100
× 120 = 24
(5.1)
Figure 5.11(b) depicts a pattern similar to Pareto layout, with cumulative
distribution displaying an 80% of wealth held by 20% of the population. The
plots for the three experiments showed that most sugar was captured between
the 20-30 agent distribution. However, the experiments for overlapping and
separate areas took longer to achieve this. This shows that the Pareto law
holds for random distributions of agent wealth, but when initial conditions
are varied their distributions changed.
X-Machines for Agent-Based Modeling: FLAME Perspectives
(a) Random mixed
distribution of agents
and sugar.
(b) Separate areas of
agents and sugars.
(c) Overlapping areas
of sugar and agents.
FIGURE 5.9: Three different initial settings for simple Sugarscape experiment. The citizen agents are represented by red dots and green dots represent
sugar agents in the scenario.
agents being quick to grab sugars close to them, displaying a positive skewness
with virtually no poor agents.
Skewness is the measure of asymmetry of data distribution. Kurtosis
is the measure of the bulge or peakedness of data distribution.
Table 5.3 summarizes the skewness and kurtosis of sugars collected at
time t = 500 during the simulation. The higher the kurtosis, the greater the
distribution between the rich and poor. The experiment with separate areas of
location for both citizens and sugars displayed the highest difference between
rich and poor. This was followed by the random distribution and lastly the
overlapping area results.
Figure 5.11 displays a cumulative distribution of the sugars gathered. The
maximum amount of sugar held by anyone of the 50 citizens was 120.
20
100
× 120 = 24
(5.1)
Figure 5.11(b) depicts a pattern similar to Pareto layout, with cumulative
distribution displaying an 80% of wealth held by 20% of the population. The
plots for the three experiments showed that most sugar was captured between
the 20-30 agent distribution. However, the experiments for overlapping and
separate areas took longer to achieve this. This shows that the Pareto law
holds for random distributions of agent wealth, but when initial conditions
are varied their distributions changed.