

Data Structures and Workflows for ICME
45
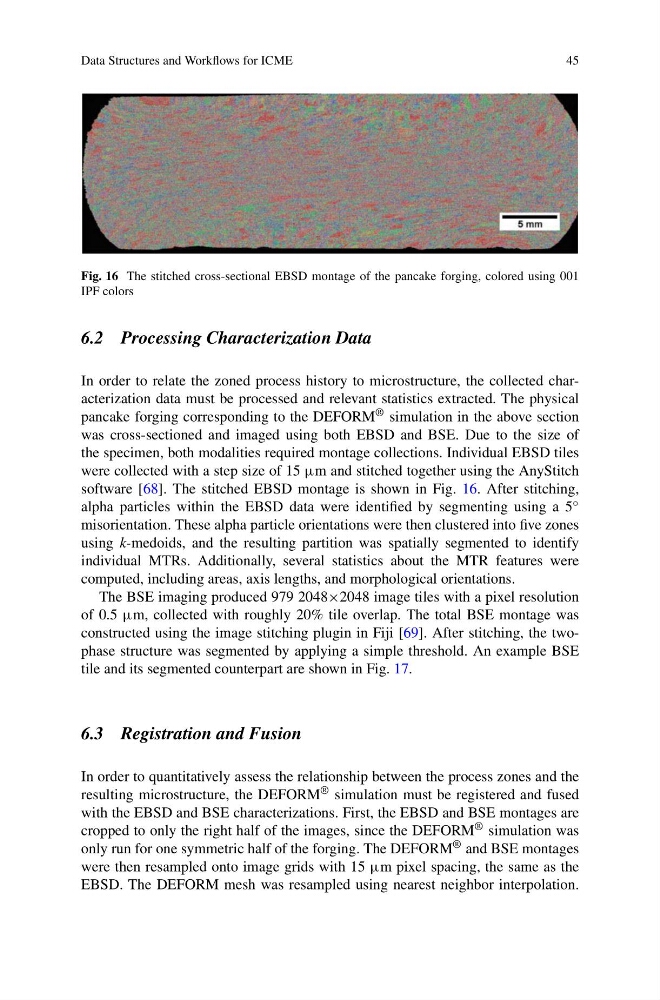
Fig. 16 The stitched cross-sectional EBSD montage of the pancake forging, colored using 001
IPF colors
6.2 Processing Characterization Data
In order to relate the zoned process history to microstructure, the collected characterization data must be processed and relevant statistics extracted. The physical
pancake forging corresponding to the DEFORM ® simulation in the above section
was cross-sectioned and imaged using both EBSD and BSE. Due to the size of
the specimen, both modalities required montage collections. Individual EBSD tiles
were collected with a step size of 15 μm and stitched together using the AnyStitch
software [68]. The stitched EBSD montage is shown in Fig. 16. After stitching,
alpha particles within the EBSD data were identified by segmenting using a 5 ◦
misorientation. These alpha particle orientations were then clustered into five zones
using k-medoids, and the resulting partition was spatially segmented to identify
individual MTRs. Additionally, several statistics about the MTR features were
computed, including areas, axis lengths, and morphological orientations.
The BSE imaging produced 979 2048×2048 image tiles with a pixel resolution
of 0.5 μm, collected with roughly 20% tile overlap. The total BSE montage was
constructed using the image stitching plugin in Fiji [69]. After stitching, the twophase structure was segmented by applying a simple threshold. An example BSE
tile and its segmented counterpart are shown in Fig. 17.
6.3 Registration and Fusion
In order to quantitatively assess the relationship between the process zones and the
resulting microstructure, the DEFORM ® simulation must be registered and fused
with the EBSD and BSE characterizations. First, the EBSD and BSE montages are
cropped to only the right half of the images, since the DEFORM ® simulation was
only run for one symmetric half of the forging. The DEFORM ® and BSE montages
were then resampled onto image grids with 15 μm pixel spacing, the same as the
EBSD. The DEFORM mesh was resampled using nearest neighbor interpolation.
45
Fig. 16 The stitched cross-sectional EBSD montage of the pancake forging, colored using 001
IPF colors
6.2 Processing Characterization Data
In order to relate the zoned process history to microstructure, the collected characterization data must be processed and relevant statistics extracted. The physical
pancake forging corresponding to the DEFORM ® simulation in the above section
was cross-sectioned and imaged using both EBSD and BSE. Due to the size of
the specimen, both modalities required montage collections. Individual EBSD tiles
were collected with a step size of 15 μm and stitched together using the AnyStitch
software [68]. The stitched EBSD montage is shown in Fig. 16. After stitching,
alpha particles within the EBSD data were identified by segmenting using a 5 ◦
misorientation. These alpha particle orientations were then clustered into five zones
using k-medoids, and the resulting partition was spatially segmented to identify
individual MTRs. Additionally, several statistics about the MTR features were
computed, including areas, axis lengths, and morphological orientations.
The BSE imaging produced 979 2048×2048 image tiles with a pixel resolution
of 0.5 μm, collected with roughly 20% tile overlap. The total BSE montage was
constructed using the image stitching plugin in Fiji [69]. After stitching, the twophase structure was segmented by applying a simple threshold. An example BSE
tile and its segmented counterpart are shown in Fig. 17.
6.3 Registration and Fusion
In order to quantitatively assess the relationship between the process zones and the
resulting microstructure, the DEFORM ® simulation must be registered and fused
with the EBSD and BSE characterizations. First, the EBSD and BSE montages are
cropped to only the right half of the images, since the DEFORM ® simulation was
only run for one symmetric half of the forging. The DEFORM ® and BSE montages
were then resampled onto image grids with 15 μm pixel spacing, the same as the
EBSD. The DEFORM mesh was resampled using nearest neighbor interpolation.