

42
S. P. Donegan and M. A. Groeber
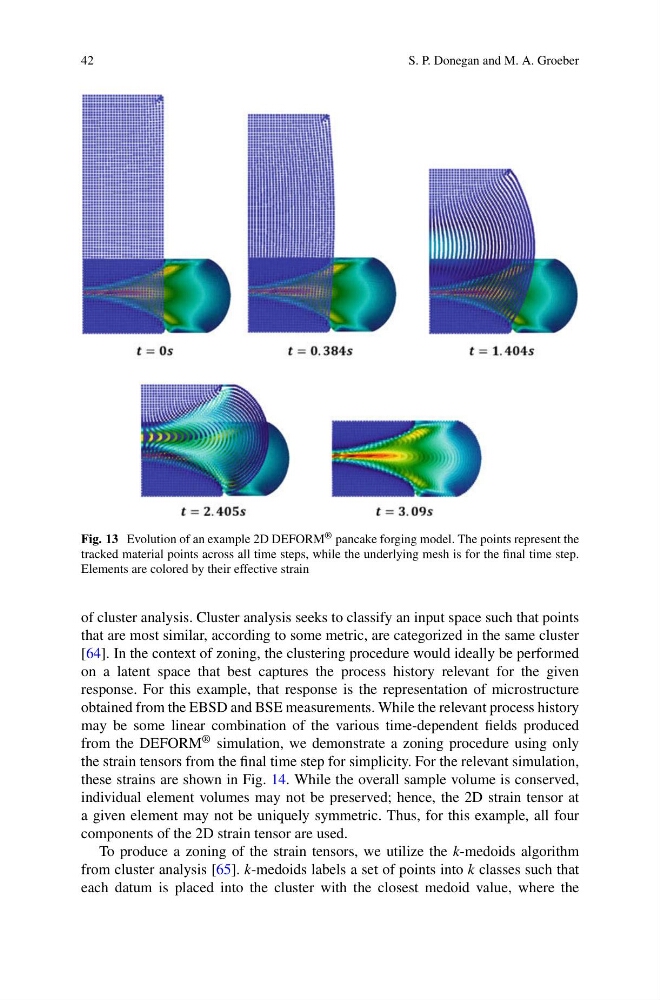
Fig. 13 Evolution of an example 2D DEFORM ® pancake forging model. The points represent the
tracked material points across all time steps, while the underlying mesh is for the final time step.
Elements are colored by their effective strain
of cluster analysis. Cluster analysis seeks to classify an input space such that points
that are most similar, according to some metric, are categorized in the same cluster
[64]. In the context of zoning, the clustering procedure would ideally be performed
on a latent space that best captures the process history relevant for the given
response. For this example, that response is the representation of microstructure
obtained from the EBSD and BSE measurements. While the relevant process history
may be some linear combination of the various time-dependent fields produced
from the DEFORM ® simulation, we demonstrate a zoning procedure using only
the strain tensors from the final time step for simplicity. For the relevant simulation,
these strains are shown in Fig. 14. While the overall sample volume is conserved,
individual element volumes may not be preserved; hence, the 2D strain tensor at
a given element may not be uniquely symmetric. Thus, for this example, all four
components of the 2D strain tensor are used.
To produce a zoning of the strain tensors, we utilize the k-medoids algorithm
from cluster analysis [65]. k-medoids labels a set of points into k classes such that
each datum is placed into the cluster with the closest medoid value, where the
S. P. Donegan and M. A. Groeber
Fig. 13 Evolution of an example 2D DEFORM ® pancake forging model. The points represent the
tracked material points across all time steps, while the underlying mesh is for the final time step.
Elements are colored by their effective strain
of cluster analysis. Cluster analysis seeks to classify an input space such that points
that are most similar, according to some metric, are categorized in the same cluster
[64]. In the context of zoning, the clustering procedure would ideally be performed
on a latent space that best captures the process history relevant for the given
response. For this example, that response is the representation of microstructure
obtained from the EBSD and BSE measurements. While the relevant process history
may be some linear combination of the various time-dependent fields produced
from the DEFORM ® simulation, we demonstrate a zoning procedure using only
the strain tensors from the final time step for simplicity. For the relevant simulation,
these strains are shown in Fig. 14. While the overall sample volume is conserved,
individual element volumes may not be preserved; hence, the 2D strain tensor at
a given element may not be uniquely symmetric. Thus, for this example, all four
components of the 2D strain tensor are used.
To produce a zoning of the strain tensors, we utilize the k-medoids algorithm
from cluster analysis [65]. k-medoids labels a set of points into k classes such that
each datum is placed into the cluster with the closest medoid value, where the