

352
A. Agrawal et al.
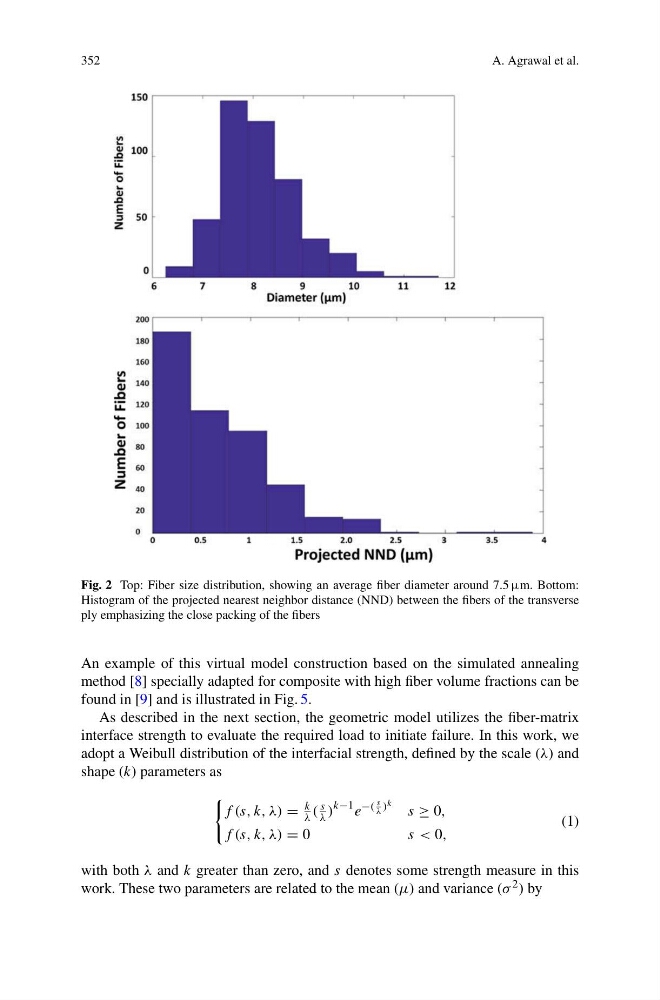
Fig. 2 Top: Fiber size distribution, showing an average fiber diameter around 7.5 μm. Bottom:
Histogram of the projected nearest neighbor distance (NND) between the fibers of the transverse
ply emphasizing the close packing of the fibers
An example of this virtual model construction based on the simulated annealing
method [8] specially adapted for composite with high fiber volume fractions can be
found in [9] and is illustrated in Fig. 5.
As described in the next section, the geometric model utilizes the fiber-matrix
interface strength to evaluate the required load to initiate failure. In this work, we
adopt a Weibull distribution of the interfacial strength, defined by the scale (λ) and
shape (k) parameters as
f (s, k, λ) =
k
λ (
s
λ )
k−1 e
−(
s
λ ) k s ≥ 0,
f (s, k, λ) = 0
s < 0,
(1)
with both λ and k greater than zero, and s denotes some strength measure in this
work. These two parameters are related to the mean (μ) and variance (σ 2 ) by
A. Agrawal et al.
Fig. 2 Top: Fiber size distribution, showing an average fiber diameter around 7.5 μm. Bottom:
Histogram of the projected nearest neighbor distance (NND) between the fibers of the transverse
ply emphasizing the close packing of the fibers
An example of this virtual model construction based on the simulated annealing
method [8] specially adapted for composite with high fiber volume fractions can be
found in [9] and is illustrated in Fig. 5.
As described in the next section, the geometric model utilizes the fiber-matrix
interface strength to evaluate the required load to initiate failure. In this work, we
adopt a Weibull distribution of the interfacial strength, defined by the scale (λ) and
shape (k) parameters as
f (s, k, λ) =
k
λ (
s
λ )
k−1 e
−(
s
λ ) k s ≥ 0,
f (s, k, λ) = 0
s < 0,
(1)
with both λ and k greater than zero, and s denotes some strength measure in this
work. These two parameters are related to the mean (μ) and variance (σ 2 ) by