

Transverse Failure of Unidirectional Composites: Sensitivity to Interfacial Properties
343
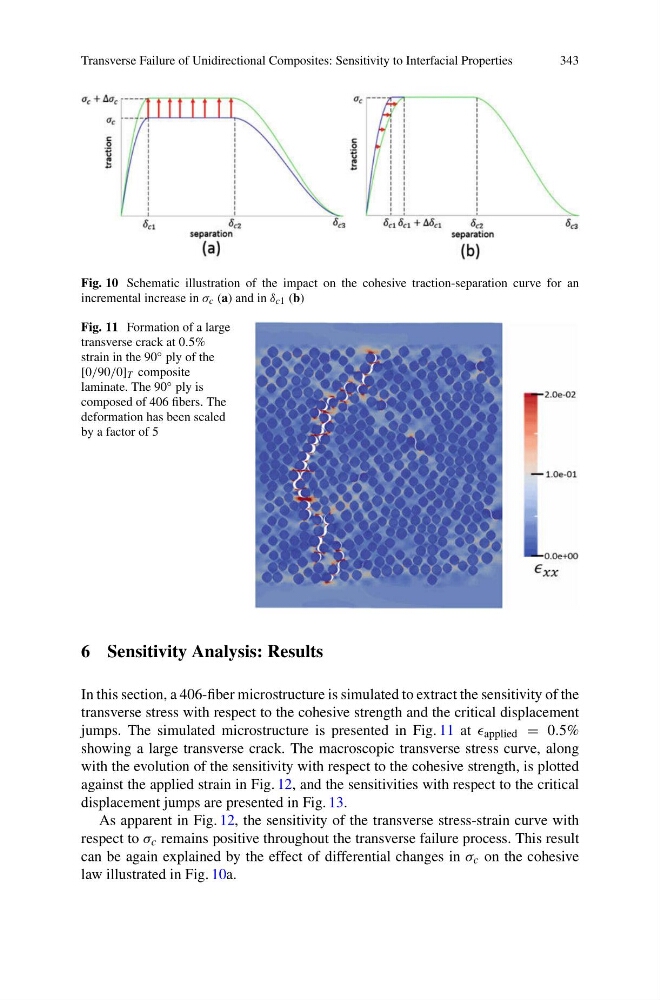
Fig. 10 Schematic illustration of the impact on the cohesive traction-separation curve for an
incremental increase in σ c (a) and in δ c1 (b)
Fig. 11 Formation of a large
transverse crack at 0.5%
strain in the 90 ◦ ply of the
[0/90/0] T composite
laminate. The 90 ◦ ply is
composed of 406 fibers. The
deformation has been scaled
by a factor of 5
6 Sensitivity Analysis: Results
In this section, a 406-fiber microstructure is simulated to extract the sensitivity of the
transverse stress with respect to the cohesive strength and the critical displacement
jumps. The simulated microstructure is presented in Fig. 11 at applied = 0.5%
showing a large transverse crack. The macroscopic transverse stress curve, along
with the evolution of the sensitivity with respect to the cohesive strength, is plotted
against the applied strain in Fig. 12, and the sensitivities with respect to the critical
displacement jumps are presented in Fig. 13.
As apparent in Fig. 12, the sensitivity of the transverse stress-strain curve with
respect to σ c remains positive throughout the transverse failure process. This result
can be again explained by the effect of differential changes in σ c on the cohesive
law illustrated in Fig. 10a.
343
Fig. 10 Schematic illustration of the impact on the cohesive traction-separation curve for an
incremental increase in σ c (a) and in δ c1 (b)
Fig. 11 Formation of a large
transverse crack at 0.5%
strain in the 90 ◦ ply of the
[0/90/0] T composite
laminate. The 90 ◦ ply is
composed of 406 fibers. The
deformation has been scaled
by a factor of 5
6 Sensitivity Analysis: Results
In this section, a 406-fiber microstructure is simulated to extract the sensitivity of the
transverse stress with respect to the cohesive strength and the critical displacement
jumps. The simulated microstructure is presented in Fig. 11 at applied = 0.5%
showing a large transverse crack. The macroscopic transverse stress curve, along
with the evolution of the sensitivity with respect to the cohesive strength, is plotted
against the applied strain in Fig. 12, and the sensitivities with respect to the critical
displacement jumps are presented in Fig. 13.
As apparent in Fig. 12, the sensitivity of the transverse stress-strain curve with
respect to σ c remains positive throughout the transverse failure process. This result
can be again explained by the effect of differential changes in σ c on the cohesive
law illustrated in Fig. 10a.