

318
S. Ghosh et al.
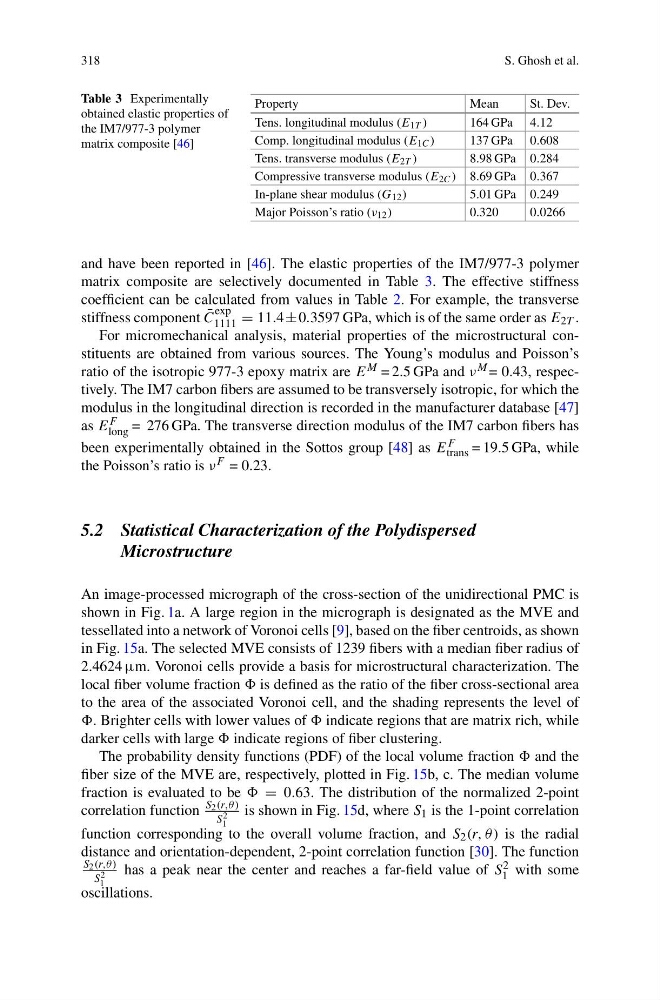
Table 3 Experimentally
obtained elastic properties of
the IM7/977-3 polymer
matrix composite [46]
Property
Mean
St. Dev.
Tens. longitudinal modulus (E 1T )
164 GPa 4.12
Comp. longitudinal modulus (E 1C )
137 GPa 0.608
Tens. transverse modulus (E 2T )
8.98 GPa 0.284
Compressive transverse modulus (E 2C ) 8.69 GPa 0.367
In-plane shear modulus (G 12 )
5.01 GPa 0.249
Major Poisson’s ratio (ν 12 )
0.320
0.0266
and have been reported in [46]. The elastic properties of the IM7/977-3 polymer
matrix composite are selectively documented in Table 3. The effective stiffness
coefficient can be calculated from values in Table 2. For example, the transverse
stiffness component ¯
C
exp
1111 = 11.4± 0.3597 GPa, which is of the same order as E 2T .
For micromechanical analysis, material properties of the microstructural constituents are obtained from various sources. The Young’s modulus and Poisson’s
ratio of the isotropic 977-3 epoxy matrix are E M = 2.5 GPa and ν M = 0.43, respectively. The IM7 carbon fibers are assumed to be transversely isotropic, for which the
modulus in the longitudinal direction is recorded in the manufacturer database [47]
as E F
long = 276 GPa. The transverse direction modulus of the IM7 carbon fibers has
been experimentally obtained in the Sottos group [48] as E F
trans = 19.5 GPa, while
the Poisson’s ratio is ν F = 0.23.
5.2 Statistical Characterization of the Polydispersed
Microstructure
An image-processed micrograph of the cross-section of the unidirectional PMC is
shown in Fig. 1a. A large region in the micrograph is designated as the MVE and
tessellated into a network of Voronoi cells [9], based on the fiber centroids, as shown
in Fig. 15a. The selected MVE consists of 1239 fibers with a median fiber radius of
2.4624 μm. Voronoi cells provide a basis for microstructural characterization. The
local fiber volume fraction is defined as the ratio of the fiber cross-sectional area
to the area of the associated Voronoi cell, and the shading represents the level of
. Brighter cells with lower values of indicate regions that are matrix rich, while
darker cells with large indicate regions of fiber clustering.
The probability density functions (PDF) of the local volume fraction and the
fiber size of the MVE are, respectively, plotted in Fig. 15b, c. The median volume
fraction is evaluated to be = 0.63. The distribution of the normalized 2-point
correlation function
S 2 (r,θ)
S 2
1
is shown in Fig. 15d, where S 1 is the 1-point correlation
function corresponding to the overall volume fraction, and S 2 (r, θ ) is the radial
distance and orientation-dependent, 2-point correlation function [30]. The function
S 2 (r,θ)
S 2
1
has a peak near the center and reaches a far-field value of S 2
1 with some
oscillations.
S. Ghosh et al.
Table 3 Experimentally
obtained elastic properties of
the IM7/977-3 polymer
matrix composite [46]
Property
Mean
St. Dev.
Tens. longitudinal modulus (E 1T )
164 GPa 4.12
Comp. longitudinal modulus (E 1C )
137 GPa 0.608
Tens. transverse modulus (E 2T )
8.98 GPa 0.284
Compressive transverse modulus (E 2C ) 8.69 GPa 0.367
In-plane shear modulus (G 12 )
5.01 GPa 0.249
Major Poisson’s ratio (ν 12 )
0.320
0.0266
and have been reported in [46]. The elastic properties of the IM7/977-3 polymer
matrix composite are selectively documented in Table 3. The effective stiffness
coefficient can be calculated from values in Table 2. For example, the transverse
stiffness component ¯
C
exp
1111 = 11.4± 0.3597 GPa, which is of the same order as E 2T .
For micromechanical analysis, material properties of the microstructural constituents are obtained from various sources. The Young’s modulus and Poisson’s
ratio of the isotropic 977-3 epoxy matrix are E M = 2.5 GPa and ν M = 0.43, respectively. The IM7 carbon fibers are assumed to be transversely isotropic, for which the
modulus in the longitudinal direction is recorded in the manufacturer database [47]
as E F
long = 276 GPa. The transverse direction modulus of the IM7 carbon fibers has
been experimentally obtained in the Sottos group [48] as E F
trans = 19.5 GPa, while
the Poisson’s ratio is ν F = 0.23.
5.2 Statistical Characterization of the Polydispersed
Microstructure
An image-processed micrograph of the cross-section of the unidirectional PMC is
shown in Fig. 1a. A large region in the micrograph is designated as the MVE and
tessellated into a network of Voronoi cells [9], based on the fiber centroids, as shown
in Fig. 15a. The selected MVE consists of 1239 fibers with a median fiber radius of
2.4624 μm. Voronoi cells provide a basis for microstructural characterization. The
local fiber volume fraction is defined as the ratio of the fiber cross-sectional area
to the area of the associated Voronoi cell, and the shading represents the level of
. Brighter cells with lower values of indicate regions that are matrix rich, while
darker cells with large indicate regions of fiber clustering.
The probability density functions (PDF) of the local volume fraction and the
fiber size of the MVE are, respectively, plotted in Fig. 15b, c. The median volume
fraction is evaluated to be = 0.63. The distribution of the normalized 2-point
correlation function
S 2 (r,θ)
S 2
1
is shown in Fig. 15d, where S 1 is the 1-point correlation
function corresponding to the overall volume fraction, and S 2 (r, θ ) is the radial
distance and orientation-dependent, 2-point correlation function [30]. The function
S 2 (r,θ)
S 2
1
has a peak near the center and reaches a far-field value of S 2
1 with some
oscillations.