

SERVE-Boundary Conditions
307
2.2 Implementation of the Exterior Statistics-Based Boundary
Conditions (ESBCs)
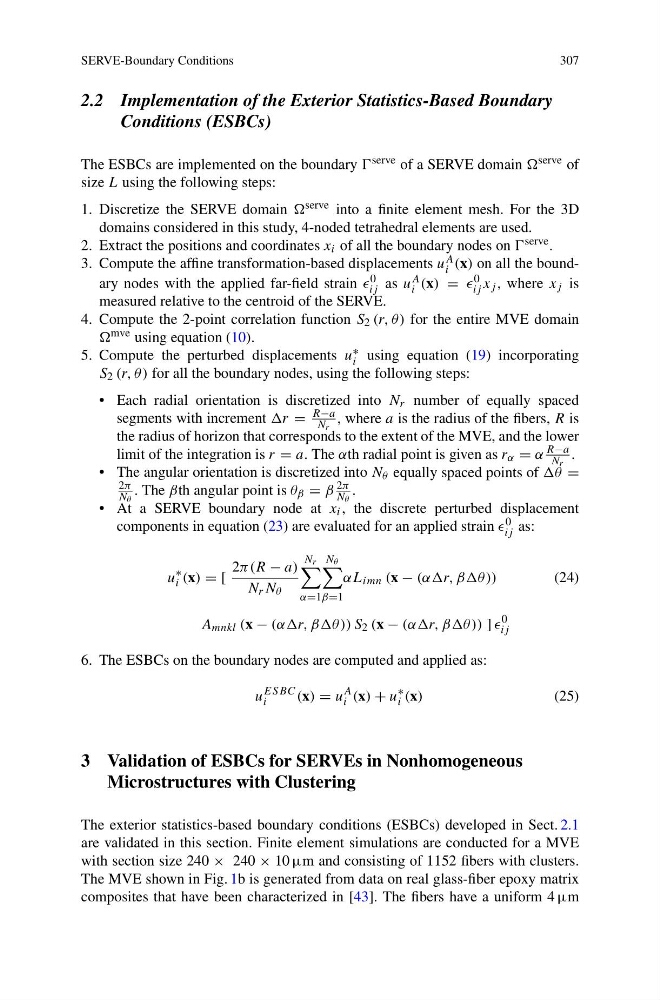
The ESBCs are implemented on the boundary serve of a SERVE domain serve of
size L using the following steps:
1. Discretize the SERVE domain serve into a finite element mesh. For the 3D
domains considered in this study, 4-noded tetrahedral elements are used.
2. Extract the positions and coordinates x i of all the boundary nodes on serve .
3. Compute the affine transformation-based displacements u A
i (x) on all the boundary nodes with the applied far-field strain 0
ij as u A
i (x) = 0
ij x j , where x j is
measured relative to the centroid of the SERVE.
4. Compute the 2-point correlation function S 2 (r, θ ) for the entire MVE domain
mve using equation (10).
5. Compute the perturbed displacements u ∗
i using equation (19) incorporating
S 2 (r, θ ) for all the boundary nodes, using the following steps:
• Each radial orientation is discretized into N r number of equally spaced
segments with increment r =
R−a
N r
, where a is the radius of the fibers, R is
the radius of horizon that corresponds to the extent of the MVE, and the lower
limit of the integration is r = a. The αth radial point is given as r α = α
R−a
N r
.
• The angular orientation is discretized into N θ equally spaced points of θ =
2π
N θ
. The βth angular point is θ β = β
2π
N θ
.
• At a SERVE boundary node at x i , the discrete perturbed displacement
components in equation (23) are evaluated for an applied strain 0
ij as:
u
∗
i (x) = [
2π(R − a)
N r N θ
N r
α=1
N θ
β=1
αL imn (x − (ααr, ββθ ))
(24)
A mnkl (x − (ααr, ββθ )) S 2 (x − (ααr, ββθ )) ]
0
ij
6. The ESBCs on the boundary nodes are computed and applied as:
u
ESBC
i
(x) = u
A
i (x) + u
∗
i (x)
(25)
3 Validation of ESBCs for SERVEs in Nonhomogeneous
Microstructures with Clustering
The exterior statistics-based boundary conditions (ESBCs) developed in Sect. 2.1
are validated in this section. Finite element simulations are conducted for a MVE
with section size 240 × 240 × 10 μm and consisting of 1152 fibers with clusters.
The MVE shown in Fig. 1b is generated from data on real glass-fiber epoxy matrix
composites that have been characterized in [43]. The fibers have a uniform 4 μm
307
2.2 Implementation of the Exterior Statistics-Based Boundary
Conditions (ESBCs)
The ESBCs are implemented on the boundary serve of a SERVE domain serve of
size L using the following steps:
1. Discretize the SERVE domain serve into a finite element mesh. For the 3D
domains considered in this study, 4-noded tetrahedral elements are used.
2. Extract the positions and coordinates x i of all the boundary nodes on serve .
3. Compute the affine transformation-based displacements u A
i (x) on all the boundary nodes with the applied far-field strain 0
ij as u A
i (x) = 0
ij x j , where x j is
measured relative to the centroid of the SERVE.
4. Compute the 2-point correlation function S 2 (r, θ ) for the entire MVE domain
mve using equation (10).
5. Compute the perturbed displacements u ∗
i using equation (19) incorporating
S 2 (r, θ ) for all the boundary nodes, using the following steps:
• Each radial orientation is discretized into N r number of equally spaced
segments with increment r =
R−a
N r
, where a is the radius of the fibers, R is
the radius of horizon that corresponds to the extent of the MVE, and the lower
limit of the integration is r = a. The αth radial point is given as r α = α
R−a
N r
.
• The angular orientation is discretized into N θ equally spaced points of θ =
2π
N θ
. The βth angular point is θ β = β
2π
N θ
.
• At a SERVE boundary node at x i , the discrete perturbed displacement
components in equation (23) are evaluated for an applied strain 0
ij as:
u
∗
i (x) = [
2π(R − a)
N r N θ
N r
α=1
N θ
β=1
αL imn (x − (ααr, ββθ ))
(24)
A mnkl (x − (ααr, ββθ )) S 2 (x − (ααr, ββθ )) ]
0
ij
6. The ESBCs on the boundary nodes are computed and applied as:
u
ESBC
i
(x) = u
A
i (x) + u
∗
i (x)
(25)
3 Validation of ESBCs for SERVEs in Nonhomogeneous
Microstructures with Clustering
The exterior statistics-based boundary conditions (ESBCs) developed in Sect. 2.1
are validated in this section. Finite element simulations are conducted for a MVE
with section size 240 × 240 × 10 μm and consisting of 1152 fibers with clusters.
The MVE shown in Fig. 1b is generated from data on real glass-fiber epoxy matrix
composites that have been characterized in [43]. The fibers have a uniform 4 μm