

258
D. Patel et al.
The data-driven framework discussed here has been employed to study the effect
of fiber architecture on the transverse matrix cracking. Patel et al. [24] have utilized
two-point correlations to quantify the microstructure at submicron length scales
where the constituents (i.e., fiber, matrix, coating, fiber interfaces) are distinctly
identifiable. More specifically, the two-point spatial correlations are defined by
f
h, h
|r
=
1
S
S
s
m
h
s m
h
s+r
(1)
where r enumerates all possible discretized vectors that can be defined on the
adopted uniform grid size describing the microstructure volume. The variable m h
i
is defined such that it is equal to one if the argument h belongs to the bin label i and
zero otherwise. The spatial correlation is defined as the conditional probability of
finding a local state h and h
at the head and tail, respectively, of a vector r arbitrarily
placed in microstructure. The local states considered for the study are fiber, coating,
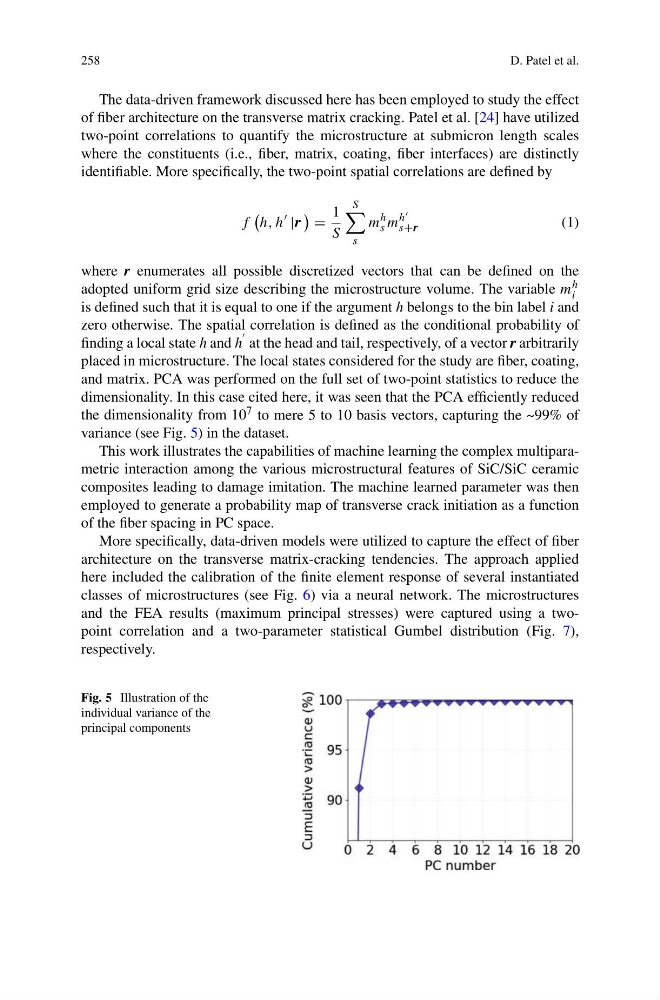
and matrix. PCA was performed on the full set of two-point statistics to reduce the
dimensionality. In this case cited here, it was seen that the PCA efficiently reduced
the dimensionality from 10 7 to mere 5 to 10 basis vectors, capturing the ~99% of
variance (see Fig. 5) in the dataset.
This work illustrates the capabilities of machine learning the complex multiparametric interaction among the various microstructural features of SiC/SiC ceramic
composites leading to damage imitation. The machine learned parameter was then
employed to generate a probability map of transverse crack initiation as a function
of the fiber spacing in PC space.
More specifically, data-driven models were utilized to capture the effect of fiber
architecture on the transverse matrix-cracking tendencies. The approach applied
here included the calibration of the finite element response of several instantiated
classes of microstructures (see Fig. 6) via a neural network. The microstructures
and the FEA results (maximum principal stresses) were captured using a twopoint correlation and a two-parameter statistical Gumbel distribution (Fig. 7),
respectively.
Fig. 5 Illustration of the
individual variance of the
principal components
D. Patel et al.
The data-driven framework discussed here has been employed to study the effect
of fiber architecture on the transverse matrix cracking. Patel et al. [24] have utilized
two-point correlations to quantify the microstructure at submicron length scales
where the constituents (i.e., fiber, matrix, coating, fiber interfaces) are distinctly
identifiable. More specifically, the two-point spatial correlations are defined by
f
h, h
|r
=
1
S
S
s
m
h
s m
h
s+r
(1)
where r enumerates all possible discretized vectors that can be defined on the
adopted uniform grid size describing the microstructure volume. The variable m h
i
is defined such that it is equal to one if the argument h belongs to the bin label i and
zero otherwise. The spatial correlation is defined as the conditional probability of
finding a local state h and h
at the head and tail, respectively, of a vector r arbitrarily
placed in microstructure. The local states considered for the study are fiber, coating,
and matrix. PCA was performed on the full set of two-point statistics to reduce the
dimensionality. In this case cited here, it was seen that the PCA efficiently reduced
the dimensionality from 10 7 to mere 5 to 10 basis vectors, capturing the ~99% of
variance (see Fig. 5) in the dataset.
This work illustrates the capabilities of machine learning the complex multiparametric interaction among the various microstructural features of SiC/SiC ceramic
composites leading to damage imitation. The machine learned parameter was then
employed to generate a probability map of transverse crack initiation as a function
of the fiber spacing in PC space.
More specifically, data-driven models were utilized to capture the effect of fiber
architecture on the transverse matrix-cracking tendencies. The approach applied
here included the calibration of the finite element response of several instantiated
classes of microstructures (see Fig. 6) via a neural network. The microstructures
and the FEA results (maximum principal stresses) were captured using a twopoint correlation and a two-parameter statistical Gumbel distribution (Fig. 7),
respectively.
Fig. 5 Illustration of the
individual variance of the
principal components