

218
C. A. Bronkhorst et al.
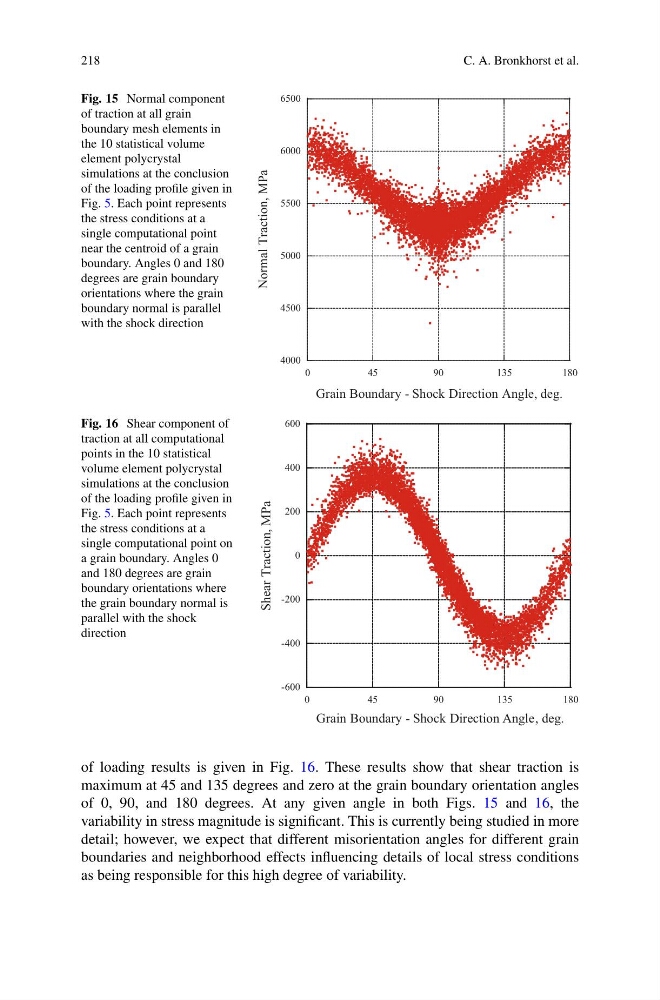
Fig. 15 Normal component
of traction at all grain
boundary mesh elements in
the 10 statistical volume
element polycrystal
simulations at the conclusion
of the loading profile given in
Fig. 5. Each point represents
the stress conditions at a
single computational point
near the centroid of a grain
boundary. Angles 0 and 180
degrees are grain boundary
orientations where the grain
boundary normal is parallel
with the shock direction
4000
4500
5000
5500
6000
6500
0
45
90
135
180
Normal Traction, MPa
Grain Boundary - Shock Direction Angle, deg.
Fig. 16 Shear component of
traction at all computational
points in the 10 statistical
volume element polycrystal
simulations at the conclusion
of the loading profile given in
Fig. 5. Each point represents
the stress conditions at a
single computational point on
a grain boundary. Angles 0
and 180 degrees are grain
boundary orientations where
the grain boundary normal is
parallel with the shock
direction
-600
-400
-200
0
200
400
600
0
45
90
135
180
Shear Traction, MPa
Grain Boundary - Shock Direction Angle, deg.
of loading results is given in Fig. 16. These results show that shear traction is
maximum at 45 and 135 degrees and zero at the grain boundary orientation angles
of 0, 90, and 180 degrees. At any given angle in both Figs. 15 and 16, the
variability in stress magnitude is significant. This is currently being studied in more
detail; however, we expect that different misorientation angles for different grain
boundaries and neighborhood effects influencing details of local stress conditions
as being responsible for this high degree of variability.
C. A. Bronkhorst et al.
Fig. 15 Normal component
of traction at all grain
boundary mesh elements in
the 10 statistical volume
element polycrystal
simulations at the conclusion
of the loading profile given in
Fig. 5. Each point represents
the stress conditions at a
single computational point
near the centroid of a grain
boundary. Angles 0 and 180
degrees are grain boundary
orientations where the grain
boundary normal is parallel
with the shock direction
4000
4500
5000
5500
6000
6500
0
45
90
135
180
Normal Traction, MPa
Grain Boundary - Shock Direction Angle, deg.
Fig. 16 Shear component of
traction at all computational
points in the 10 statistical
volume element polycrystal
simulations at the conclusion
of the loading profile given in
Fig. 5. Each point represents
the stress conditions at a
single computational point on
a grain boundary. Angles 0
and 180 degrees are grain
boundary orientations where
the grain boundary normal is
parallel with the shock
direction
-600
-400
-200
0
200
400
600
0
45
90
135
180
Shear Traction, MPa
Grain Boundary - Shock Direction Angle, deg.
of loading results is given in Fig. 16. These results show that shear traction is
maximum at 45 and 135 degrees and zero at the grain boundary orientation angles
of 0, 90, and 180 degrees. At any given angle in both Figs. 15 and 16, the
variability in stress magnitude is significant. This is currently being studied in more
detail; however, we expect that different misorientation angles for different grain
boundaries and neighborhood effects influencing details of local stress conditions
as being responsible for this high degree of variability.