

192
J. Hochhalter et al.
y
x
reference optimized
0
10
20
30
40
50
60
x displacement [μm]
y
x
reference optimized
0
100
200
300
400
500
y displacement [μm]
y
x
reference optimized
0.0
2.5
5.0
7.5
10.0
12.5
15.0
17.5
20.0
z displacement [μm]
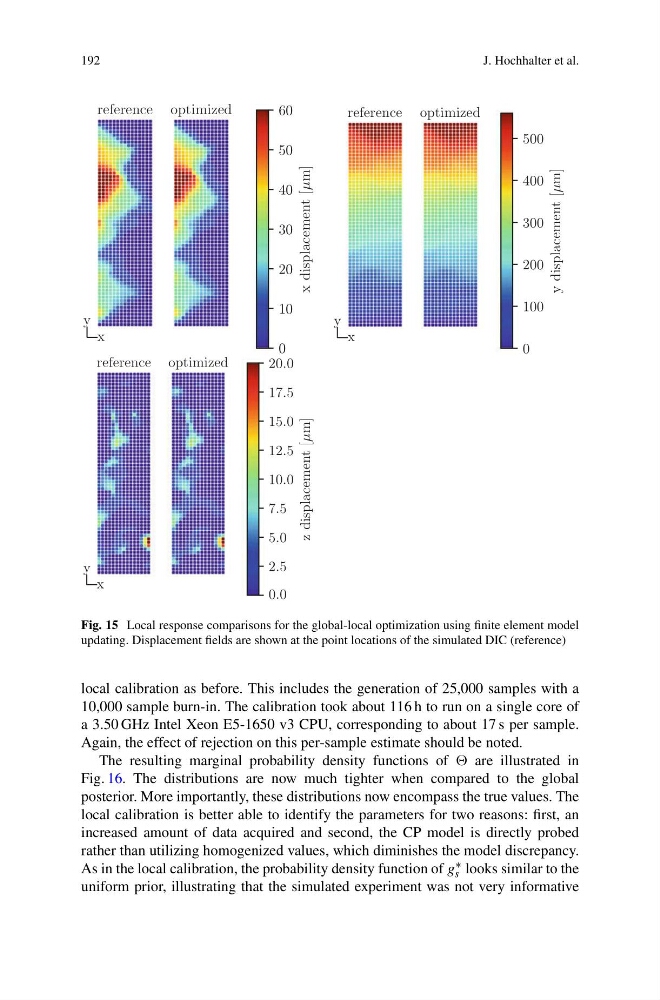
Fig. 15 Local response comparisons for the global-local optimization using finite element model
updating. Displacement fields are shown at the point locations of the simulated DIC (reference)
local calibration as before. This includes the generation of 25,000 samples with a
10,000 sample burn-in. The calibration took about 116 h to run on a single core of
a 3.50 GHz Intel Xeon E5-1650 v3 CPU, corresponding to about 17 s per sample.
Again, the effect of rejection on this per-sample estimate should be noted.
The resulting marginal probability density functions of are illustrated in
Fig. 16. The distributions are now much tighter when compared to the global
posterior. More importantly, these distributions now encompass the true values. The
local calibration is better able to identify the parameters for two reasons: first, an
increased amount of data acquired and second, the CP model is directly probed
rather than utilizing homogenized values, which diminishes the model discrepancy.
As in the local calibration, the probability density function of g ∗
s looks similar to the
uniform prior, illustrating that the simulated experiment was not very informative
J. Hochhalter et al.
y
x
reference optimized
0
10
20
30
40
50
60
x displacement [μm]
y
x
reference optimized
0
100
200
300
400
500
y displacement [μm]
y
x
reference optimized
0.0
2.5
5.0
7.5
10.0
12.5
15.0
17.5
20.0
z displacement [μm]
Fig. 15 Local response comparisons for the global-local optimization using finite element model
updating. Displacement fields are shown at the point locations of the simulated DIC (reference)
local calibration as before. This includes the generation of 25,000 samples with a
10,000 sample burn-in. The calibration took about 116 h to run on a single core of
a 3.50 GHz Intel Xeon E5-1650 v3 CPU, corresponding to about 17 s per sample.
Again, the effect of rejection on this per-sample estimate should be noted.
The resulting marginal probability density functions of are illustrated in
Fig. 16. The distributions are now much tighter when compared to the global
posterior. More importantly, these distributions now encompass the true values. The
local calibration is better able to identify the parameters for two reasons: first, an
increased amount of data acquired and second, the CP model is directly probed
rather than utilizing homogenized values, which diminishes the model discrepancy.
As in the local calibration, the probability density function of g ∗
s looks similar to the
uniform prior, illustrating that the simulated experiment was not very informative