

Non-deterministic Calibration
189
0.00
0.02
0.04
0.06
m
0
20
40
60
80
Probability density
0
500
1000
g s [MPa]
0.00000
0.00025
0.00050
0.00075
0.00100
Probability density
100
120
140
g 0 [MPa]
0.00
0.05
0.10
0.15
0.20
Probability density
0
200
400
G 0 [MPa]
0.0000
0.0025
0.0050
0.0075
0.0100
0.0125
Probability density
0
5
σ
2 [MPa
2 ]
0.0
0.2
0.4
0.6
Probability density
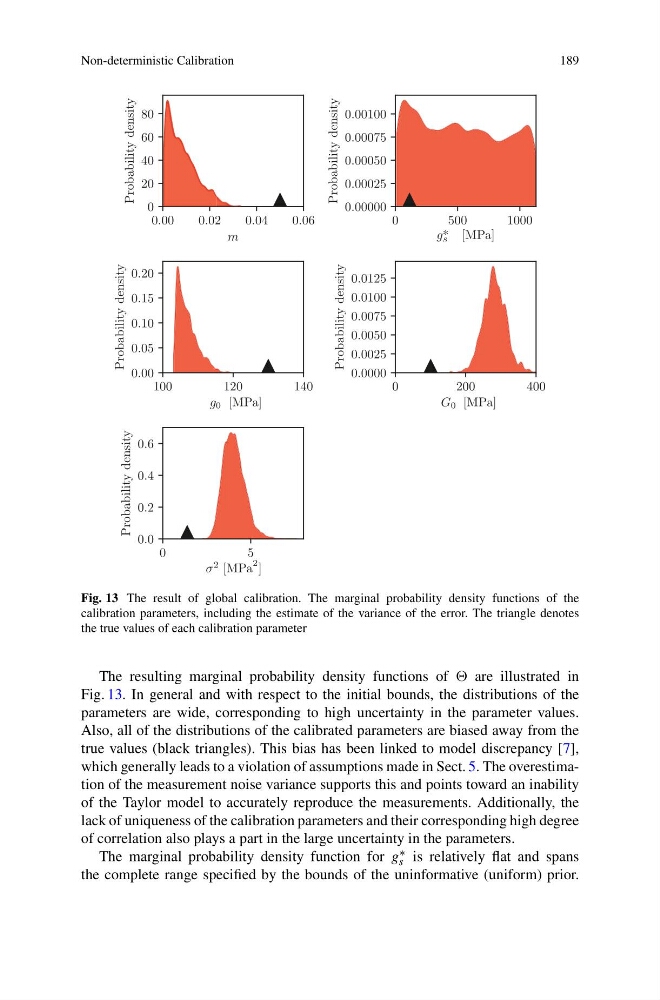
Fig. 13 The result of global calibration. The marginal probability density functions of the
calibration parameters, including the estimate of the variance of the error. The triangle denotes
the true values of each calibration parameter
The resulting marginal probability density functions of are illustrated in
Fig. 13. In general and with respect to the initial bounds, the distributions of the
parameters are wide, corresponding to high uncertainty in the parameter values.
Also, all of the distributions of the calibrated parameters are biased away from the
true values (black triangles). This bias has been linked to model discrepancy [7],
which generally leads to a violation of assumptions made in Sect. 5. The overestimation of the measurement noise variance supports this and points toward an inability
of the Taylor model to accurately reproduce the measurements. Additionally, the
lack of uniqueness of the calibration parameters and their corresponding high degree
of correlation also plays a part in the large uncertainty in the parameters.
The marginal probability density function for g ∗
s is relatively flat and spans
the complete range specified by the bounds of the uninformative (uniform) prior.
189
0.00
0.02
0.04
0.06
m
0
20
40
60
80
Probability density
0
500
1000
g s [MPa]
0.00000
0.00025
0.00050
0.00075
0.00100
Probability density
100
120
140
g 0 [MPa]
0.00
0.05
0.10
0.15
0.20
Probability density
0
200
400
G 0 [MPa]
0.0000
0.0025
0.0050
0.0075
0.0100
0.0125
Probability density
0
5
σ
2 [MPa
2 ]
0.0
0.2
0.4
0.6
Probability density
Fig. 13 The result of global calibration. The marginal probability density functions of the
calibration parameters, including the estimate of the variance of the error. The triangle denotes
the true values of each calibration parameter
The resulting marginal probability density functions of are illustrated in
Fig. 13. In general and with respect to the initial bounds, the distributions of the
parameters are wide, corresponding to high uncertainty in the parameter values.
Also, all of the distributions of the calibrated parameters are biased away from the
true values (black triangles). This bias has been linked to model discrepancy [7],
which generally leads to a violation of assumptions made in Sect. 5. The overestimation of the measurement noise variance supports this and points toward an inability
of the Taylor model to accurately reproduce the measurements. Additionally, the
lack of uniqueness of the calibration parameters and their corresponding high degree
of correlation also plays a part in the large uncertainty in the parameters.
The marginal probability density function for g ∗
s is relatively flat and spans
the complete range specified by the bounds of the uninformative (uniform) prior.