

Computational Micromechanics Modeling of Polycrystalline Superalloys. . .
133
(a)
(b)
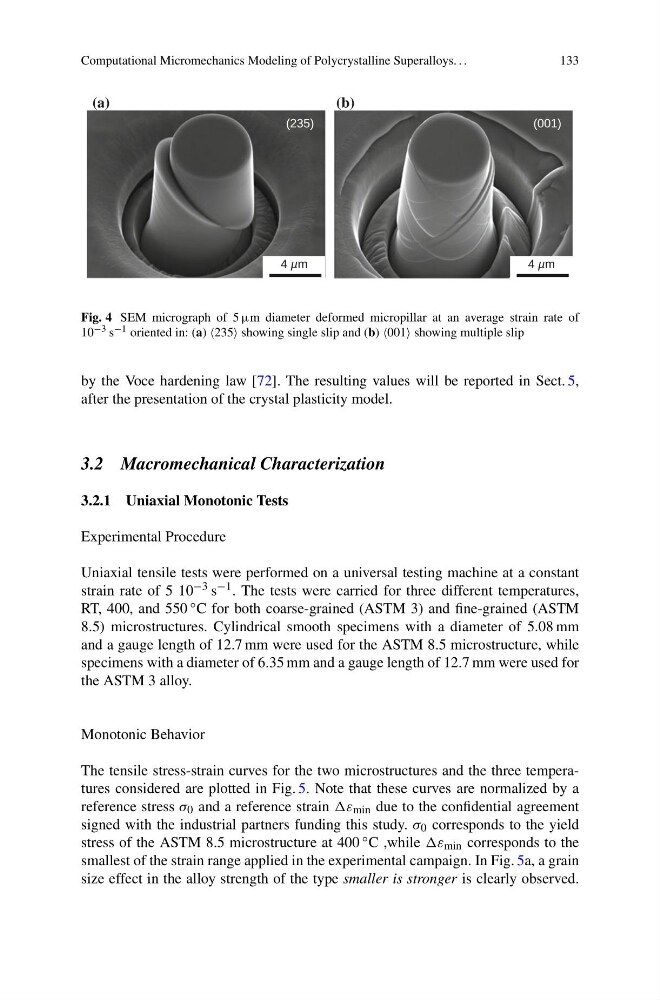
Fig. 4 SEM micrograph of 5 μm diameter deformed micropillar at an average strain rate of
10 −3 s −1 oriented in: (a) 235 showing single slip and (b) 001 showing multiple slip
by the Voce hardening law [72]. The resulting values will be reported in Sect. 5,
after the presentation of the crystal plasticity model.
3.2 Macromechanical Characterization
3.2.1 Uniaxial Monotonic Tests
Experimental Procedure
Uniaxial tensile tests were performed on a universal testing machine at a constant
strain rate of 5 10 −3 s −1 . The tests were carried for three different temperatures,
RT, 400, and 550 ◦ C for both coarse-grained (ASTM 3) and fine-grained (ASTM
8.5) microstructures. Cylindrical smooth specimens with a diameter of 5.08 mm
and a gauge length of 12.7 mm were used for the ASTM 8.5 microstructure, while
specimens with a diameter of 6.35 mm and a gauge length of 12.7 mm were used for
the ASTM 3 alloy.
Monotonic Behavior
The tensile stress-strain curves for the two microstructures and the three temperatures considered are plotted in Fig. 5. Note that these curves are normalized by a
reference stress σ 0 and a reference strain ε min due to the confidential agreement
signed with the industrial partners funding this study. σ 0 corresponds to the yield
stress of the ASTM 8.5 microstructure at 400 ◦ C ,while ε min corresponds to the
smallest of the strain range applied in the experimental campaign. In Fig. 5a, a grain
size effect in the alloy strength of the type smaller is stronger is clearly observed.
133
(a)
(b)
Fig. 4 SEM micrograph of 5 μm diameter deformed micropillar at an average strain rate of
10 −3 s −1 oriented in: (a) 235 showing single slip and (b) 001 showing multiple slip
by the Voce hardening law [72]. The resulting values will be reported in Sect. 5,
after the presentation of the crystal plasticity model.
3.2 Macromechanical Characterization
3.2.1 Uniaxial Monotonic Tests
Experimental Procedure
Uniaxial tensile tests were performed on a universal testing machine at a constant
strain rate of 5 10 −3 s −1 . The tests were carried for three different temperatures,
RT, 400, and 550 ◦ C for both coarse-grained (ASTM 3) and fine-grained (ASTM
8.5) microstructures. Cylindrical smooth specimens with a diameter of 5.08 mm
and a gauge length of 12.7 mm were used for the ASTM 8.5 microstructure, while
specimens with a diameter of 6.35 mm and a gauge length of 12.7 mm were used for
the ASTM 3 alloy.
Monotonic Behavior
The tensile stress-strain curves for the two microstructures and the three temperatures considered are plotted in Fig. 5. Note that these curves are normalized by a
reference stress σ 0 and a reference strain ε min due to the confidential agreement
signed with the industrial partners funding this study. σ 0 corresponds to the yield
stress of the ASTM 8.5 microstructure at 400 ◦ C ,while ε min corresponds to the
smallest of the strain range applied in the experimental campaign. In Fig. 5a, a grain
size effect in the alloy strength of the type smaller is stronger is clearly observed.