

64
Chapter 5. Modelling asymmetric relationships
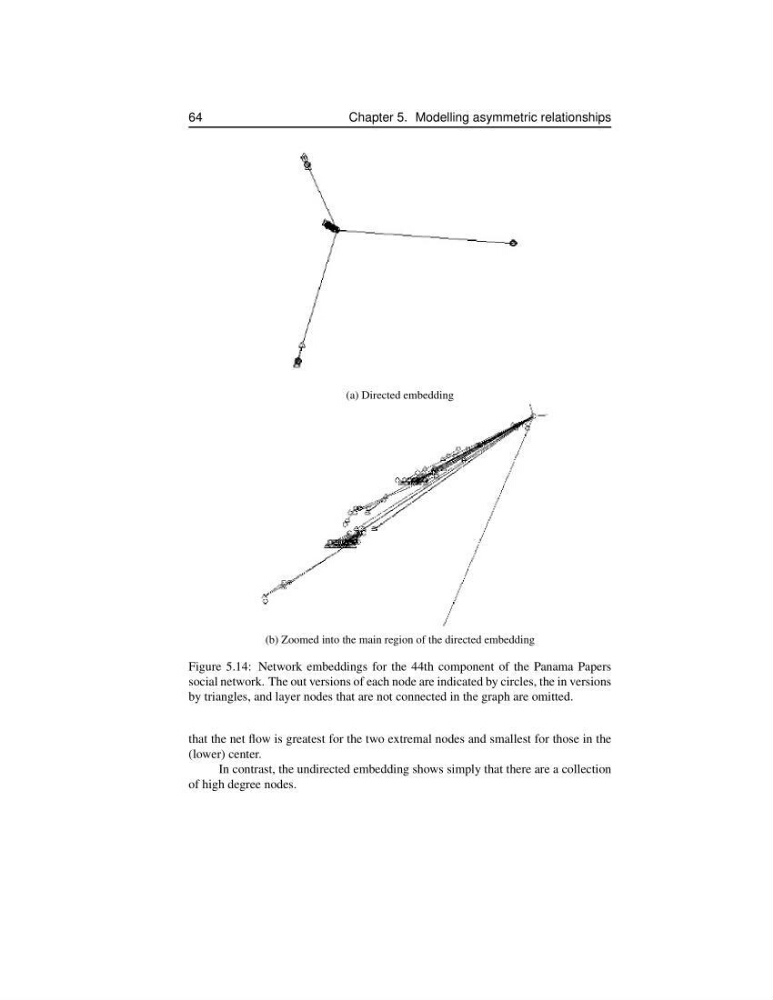
(a) Directed embedding
(b) Zoomed into the main region of the directed embedding
Figure 5.14: Network embeddings for the 44th component of the Panama Papers
social network. The out versions of each node are indicated by circles, the in versions
by triangles, and layer nodes that are not connected in the graph are omitted.
that the net flow is greatest for the two extremal nodes and smallest for those in the
(lower) center.
In contrast, the undirected embedding shows simply that there are a collection
of high degree nodes.
Chapter 5. Modelling asymmetric relationships
(a) Directed embedding
(b) Zoomed into the main region of the directed embedding
Figure 5.14: Network embeddings for the 44th component of the Panama Papers
social network. The out versions of each node are indicated by circles, the in versions
by triangles, and layer nodes that are not connected in the graph are omitted.
that the net flow is greatest for the two extremal nodes and smallest for those in the
(lower) center.
In contrast, the undirected embedding shows simply that there are a collection
of high degree nodes.