

116
Chapter 8. Modelling positive and negative relationships
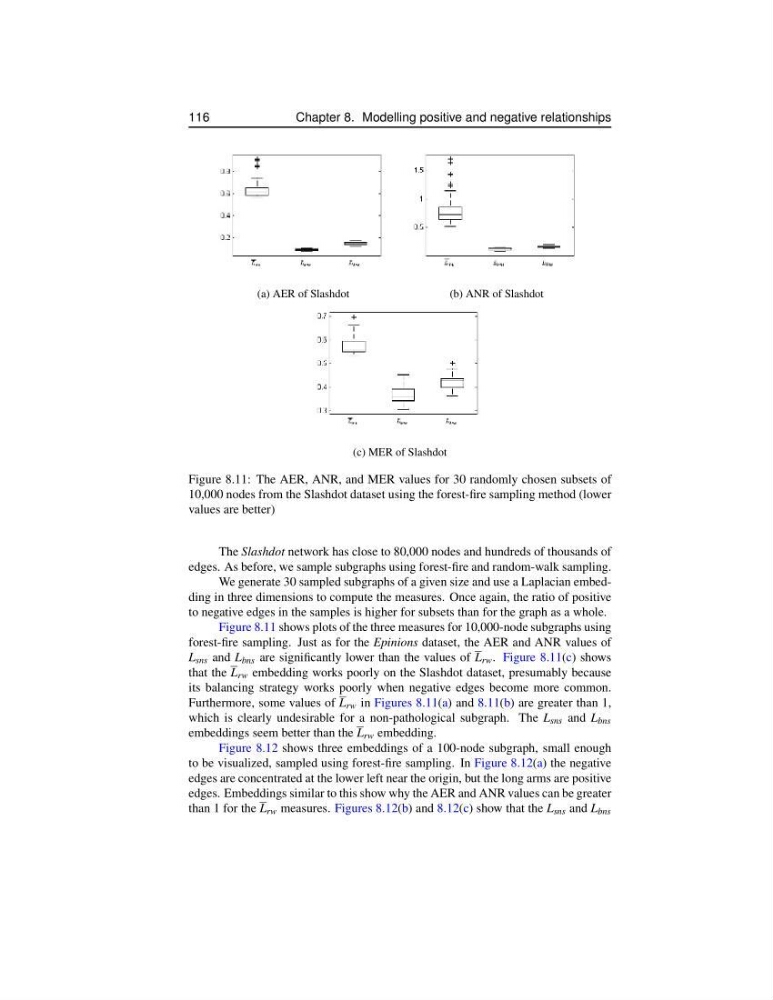
(a) AER of Slashdot
(b) ANR of Slashdot
(c) MER of Slashdot
Figure 8.11: The AER, ANR, and MER values for 30 randomly chosen subsets of
10,000 nodes from the Slashdot dataset using the forest-fire sampling method (lower
values are better)
The Slashdot network has close to 80,000 nodes and hundreds of thousands of
edges. As before, we sample subgraphs using forest-fire and random-walk sampling.
We generate 30 sampled subgraphs of a given size and use a Laplacian embedding in three dimensions to compute the measures. Once again, the ratio of positive
to negative edges in the samples is higher for subsets than for the graph as a whole.
Figure 8.11 shows plots of the three measures for 10,000-node subgraphs using
forest-fire sampling. Just as for the Epinions dataset, the AER and ANR values of
L sns and L bns are significantly lower than the values of L rw . Figure 8.11(c) shows
that the L rw embedding works poorly on the Slashdot dataset, presumably because
its balancing strategy works poorly when negative edges become more common.
Furthermore, some values of L rw in Figures 8.11(a) and 8.11(b) are greater than 1,
which is clearly undesirable for a non-pathological subgraph. The L sns and L bns
embeddings seem better than the L rw embedding.
Figure 8.12 shows three embeddings of a 100-node subgraph, small enough
to be visualized, sampled using forest-fire sampling. In Figure 8.12(a) the negative
edges are concentrated at the lower left near the origin, but the long arms are positive
edges. Embeddings similar to this show why the AER and ANR values can be greater
than 1 for the L rw measures. Figures 8.12(b) and 8.12(c) show that the L sns and L bns
Chapter 8. Modelling positive and negative relationships
(a) AER of Slashdot
(b) ANR of Slashdot
(c) MER of Slashdot
Figure 8.11: The AER, ANR, and MER values for 30 randomly chosen subsets of
10,000 nodes from the Slashdot dataset using the forest-fire sampling method (lower
values are better)
The Slashdot network has close to 80,000 nodes and hundreds of thousands of
edges. As before, we sample subgraphs using forest-fire and random-walk sampling.
We generate 30 sampled subgraphs of a given size and use a Laplacian embedding in three dimensions to compute the measures. Once again, the ratio of positive
to negative edges in the samples is higher for subsets than for the graph as a whole.
Figure 8.11 shows plots of the three measures for 10,000-node subgraphs using
forest-fire sampling. Just as for the Epinions dataset, the AER and ANR values of
L sns and L bns are significantly lower than the values of L rw . Figure 8.11(c) shows
that the L rw embedding works poorly on the Slashdot dataset, presumably because
its balancing strategy works poorly when negative edges become more common.
Furthermore, some values of L rw in Figures 8.11(a) and 8.11(b) are greater than 1,
which is clearly undesirable for a non-pathological subgraph. The L sns and L bns
embeddings seem better than the L rw embedding.
Figure 8.12 shows three embeddings of a 100-node subgraph, small enough
to be visualized, sampled using forest-fire sampling. In Figure 8.12(a) the negative
edges are concentrated at the lower left near the origin, but the long arms are positive
edges. Embeddings similar to this show why the AER and ANR values can be greater
than 1 for the L rw measures. Figures 8.12(b) and 8.12(c) show that the L sns and L bns