

92
Chapter 7. Modelling relationships that change over time
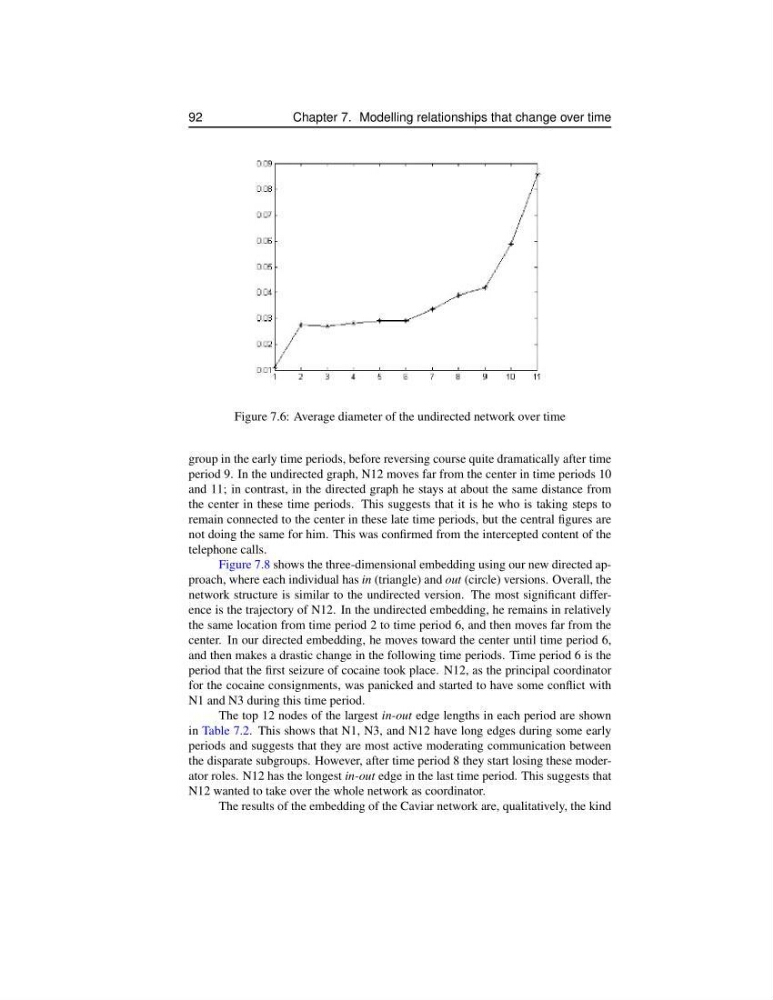
Figure 7.6: Average diameter of the undirected network over time
group in the early time periods, before reversing course quite dramatically after time
period 9. In the undirected graph, N12 moves far from the center in time periods 10
and 11; in contrast, in the directed graph he stays at about the same distance from
the center in these time periods. This suggests that it is he who is taking steps to
remain connected to the center in these late time periods, but the central figures are
not doing the same for him. This was confirmed from the intercepted content of the
telephone calls.
Figure 7.8 shows the three-dimensional embedding using our new directed approach, where each individual has in (triangle) and out (circle) versions. Overall, the
network structure is similar to the undirected version. The most significant difference is the trajectory of N12. In the undirected embedding, he remains in relatively
the same location from time period 2 to time period 6, and then moves far from the
center. In our directed embedding, he moves toward the center until time period 6,
and then makes a drastic change in the following time periods. Time period 6 is the
period that the first seizure of cocaine took place. N12, as the principal coordinator
for the cocaine consignments, was panicked and started to have some conflict with
N1 and N3 during this time period.
The top 12 nodes of the largest in-out edge lengths in each period are shown
in Table 7.2. This shows that N1, N3, and N12 have long edges during some early
periods and suggests that they are most active moderating communication between
the disparate subgroups. However, after time period 8 they start losing these moderator roles. N12 has the longest in-out edge in the last time period. This suggests that
N12 wanted to take over the whole network as coordinator.
The results of the embedding of the Caviar network are, qualitatively, the kind
Chapter 7. Modelling relationships that change over time
Figure 7.6: Average diameter of the undirected network over time
group in the early time periods, before reversing course quite dramatically after time
period 9. In the undirected graph, N12 moves far from the center in time periods 10
and 11; in contrast, in the directed graph he stays at about the same distance from
the center in these time periods. This suggests that it is he who is taking steps to
remain connected to the center in these late time periods, but the central figures are
not doing the same for him. This was confirmed from the intercepted content of the
telephone calls.
Figure 7.8 shows the three-dimensional embedding using our new directed approach, where each individual has in (triangle) and out (circle) versions. Overall, the
network structure is similar to the undirected version. The most significant difference is the trajectory of N12. In the undirected embedding, he remains in relatively
the same location from time period 2 to time period 6, and then moves far from the
center. In our directed embedding, he moves toward the center until time period 6,
and then makes a drastic change in the following time periods. Time period 6 is the
period that the first seizure of cocaine took place. N12, as the principal coordinator
for the cocaine consignments, was panicked and started to have some conflict with
N1 and N3 during this time period.
The top 12 nodes of the largest in-out edge lengths in each period are shown
in Table 7.2. This shows that N1, N3, and N12 have long edges during some early
periods and suggests that they are most active moderating communication between
the disparate subgroups. However, after time period 8 they start losing these moderator roles. N12 has the longest in-out edge in the last time period. This suggests that
N12 wanted to take over the whole network as coordinator.
The results of the embedding of the Caviar network are, qualitatively, the kind