

292
Compact Models for Integrated Circuit Design
σ
σ
σ
σ σ
random pair
th
th
th
th
V
V
V
V
-
(
)
=
−
= ( )≡ ( )
1
2
∆
(8.6)
In order to determine the local V th variability (also referred to as the mismatch)
in devices, V th shifts (ΔV th ) between the closely spaced identical paired transistors are measured for a large number of pairs. Any standard procedure
can be used to extract V th for individual devices. Typically, the V th extraction
procedure is used on a set of device geometries (L, W) for both n-channel
and p-channel MOSFETs. Then, σΔV th is plotted as a function of 1/ W L
eff eff as
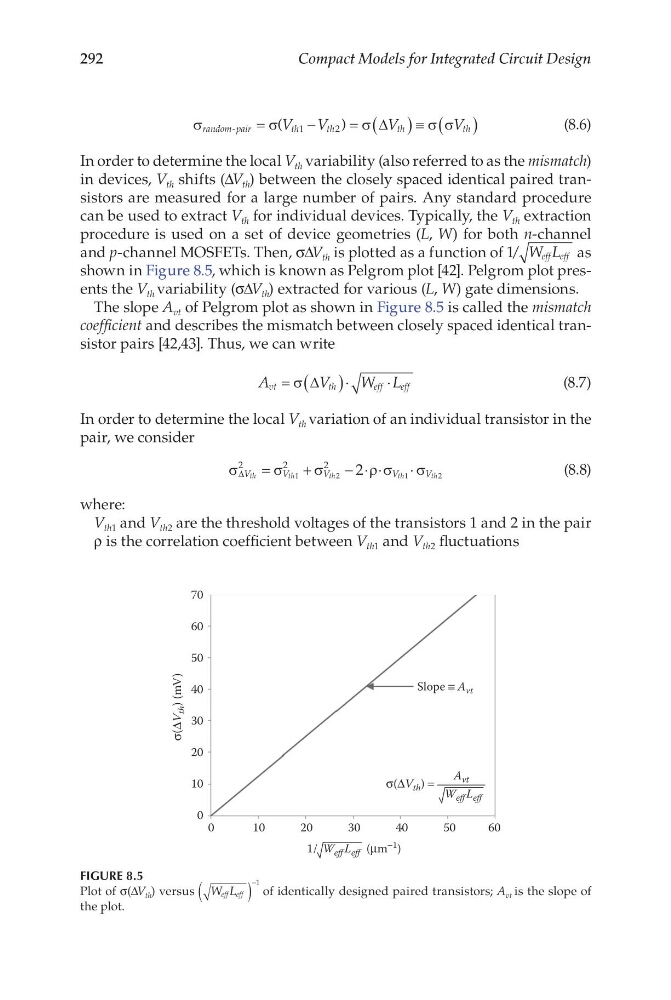
shown in Figure 8.5, which is known as Pelgrom plot [42]. Pelgrom plot presents the V th variability (σΔV th ) extracted for various (L, W) gate dimensions.
The slope A vt of Pelgrom plot as shown in Figure 8.5 is called the mismatch
coefficient and describes the mismatch between closely spaced identical transistor pairs [42,43]. Thus, we can write
A
V
W L
vt
th
eff
e ff
= ( )⋅
⋅
σ ∆
(8.7)
In order to determine the local V th variation of an individual transistor in the
pair, we consider
σ
σ
σ
ρσ
σ
∆V
V
V
V
V
th
th
th
th
th
2
2
2
1
2
1
2
2
=
+
− ⋅ ⋅
⋅
(8.8)
where:
V th1 and V th2 are the threshold voltages of the transistors 1 and 2 in the pair
ρ is the correlation coefficient between V th1 and V th2 fluctuations
0
0
10
20
30
40
σ(ΔV
th ) (mV)
50
Slope ≡ A vt
σ(ΔV th ) =
60
70
10
20
30
40
50
60
A vt
W eff L eff
1/
(μm
−1 )
W eff L eff
FIGURE 8.5
Plot of σ(ΔV th ) versus W L
eff eff
(
)
−1 of identically designed paired transistors; A vt is the slope of
the plot.
Compact Models for Integrated Circuit Design
σ
σ
σ
σ σ
random pair
th
th
th
th
V
V
V
V
-
(
)
=
−
= ( )≡ ( )
1
2
∆
(8.6)
In order to determine the local V th variability (also referred to as the mismatch)
in devices, V th shifts (ΔV th ) between the closely spaced identical paired transistors are measured for a large number of pairs. Any standard procedure
can be used to extract V th for individual devices. Typically, the V th extraction
procedure is used on a set of device geometries (L, W) for both n-channel
and p-channel MOSFETs. Then, σΔV th is plotted as a function of 1/ W L
eff eff as
shown in Figure 8.5, which is known as Pelgrom plot [42]. Pelgrom plot presents the V th variability (σΔV th ) extracted for various (L, W) gate dimensions.
The slope A vt of Pelgrom plot as shown in Figure 8.5 is called the mismatch
coefficient and describes the mismatch between closely spaced identical transistor pairs [42,43]. Thus, we can write
A
V
W L
vt
th
eff
e ff
= ( )⋅
⋅
σ ∆
(8.7)
In order to determine the local V th variation of an individual transistor in the
pair, we consider
σ
σ
σ
ρσ
σ
∆V
V
V
V
V
th
th
th
th
th
2
2
2
1
2
1
2
2
=
+
− ⋅ ⋅
⋅
(8.8)
where:
V th1 and V th2 are the threshold voltages of the transistors 1 and 2 in the pair
ρ is the correlation coefficient between V th1 and V th2 fluctuations
0
0
10
20
30
40
σ(ΔV
th ) (mV)
50
Slope ≡ A vt
σ(ΔV th ) =
60
70
10
20
30
40
50
60
A vt
W eff L eff
1/
(μm
−1 )
W eff L eff
FIGURE 8.5
Plot of σ(ΔV th ) versus W L
eff eff
(
)
−1 of identically designed paired transistors; A vt is the slope of
the plot.