

79
Review of Basic Device Physics
Exercises
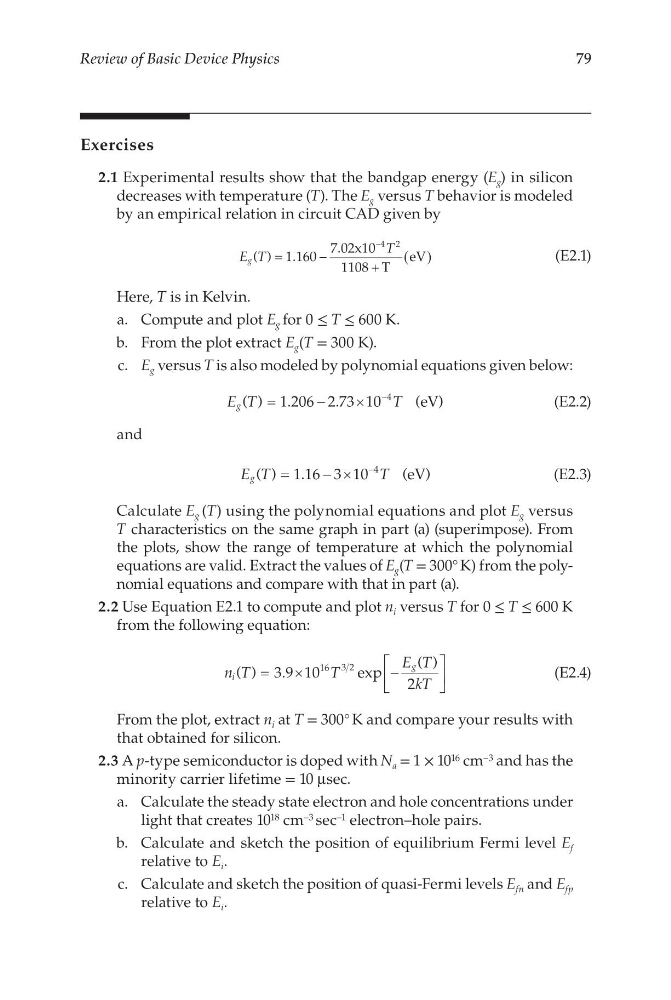
2.1 Experimental results show that the bandgap energy (E g ) in silicon
decreases with temperature (T). The E g versus T behavior is modeled
by an empirical relation in circuit CAD given by
E T
T
g ( )
.
.
=
−
+
( )
−
1 160
7 02 10
4 2
x
1108 T
eV
(E2.1)
Here, T is in Kelvin.
a. Compute and plot E g for 0 ≤ T ≤ 600 K.
b. From the plot extract E g (T = 300 K).
c. E g versus T is also modeled by polynomial equations given below:
E T
T
g ( )
.
.
=
−
−
1 206 2 73 10
4
×
(eV)
(E2.2)
and
E T
T
g ( )
.
=
−
−
1 16 3 10
4
×
(eV)
(E2.3)
Calculate E g (T) using the polynomial equations and plot E g versus
T characteristics on the same graph in part (a) (superimpose). From
the plots, show the range of temperature at which the polynomial
equations are valid. Extract the values of E g (T = 300° K) from the polynomial equations and compare with that in part (a).
2.2 Use Equation E2.1 to compute and plot n i versus T for 0 ≤ T ≤ 600 K
from the following equation:
n T
T
E T
kT
i
g
( )
.
e xp
( )
=
×
−
3 9 10
2
16 3 2
(E2.4)
From the plot, extract n i at T = 300° K and compare your results with
that obtained for silicon.
2.3 A p-type semiconductor is doped with N a = 1 × 10 16 cm –3 and has the
minority carrier lifetime = 10 μsec.
a. Calculate the steady state electron and hole concentrations under
light that creates 10 18 cm –3 sec –1 electron–hole pairs.
b. Calculate and sketch the position of equilibrium Fermi level E f
relative to E i .
c. Calculate and sketch the position of quasi-Fermi levels E fn and E fp
relative to E i .
Review of Basic Device Physics
Exercises
2.1 Experimental results show that the bandgap energy (E g ) in silicon
decreases with temperature (T). The E g versus T behavior is modeled
by an empirical relation in circuit CAD given by
E T
T
g ( )
.
.
=
−
+
( )
−
1 160
7 02 10
4 2
x
1108 T
eV
(E2.1)
Here, T is in Kelvin.
a. Compute and plot E g for 0 ≤ T ≤ 600 K.
b. From the plot extract E g (T = 300 K).
c. E g versus T is also modeled by polynomial equations given below:
E T
T
g ( )
.
.
=
−
−
1 206 2 73 10
4
×
(eV)
(E2.2)
and
E T
T
g ( )
.
=
−
−
1 16 3 10
4
×
(eV)
(E2.3)
Calculate E g (T) using the polynomial equations and plot E g versus
T characteristics on the same graph in part (a) (superimpose). From
the plots, show the range of temperature at which the polynomial
equations are valid. Extract the values of E g (T = 300° K) from the polynomial equations and compare with that in part (a).
2.2 Use Equation E2.1 to compute and plot n i versus T for 0 ≤ T ≤ 600 K
from the following equation:
n T
T
E T
kT
i
g
( )
.
e xp
( )
=
×
−
3 9 10
2
16 3 2
(E2.4)
From the plot, extract n i at T = 300° K and compare your results with
that obtained for silicon.
2.3 A p-type semiconductor is doped with N a = 1 × 10 16 cm –3 and has the
minority carrier lifetime = 10 μsec.
a. Calculate the steady state electron and hole concentrations under
light that creates 10 18 cm –3 sec –1 electron–hole pairs.
b. Calculate and sketch the position of equilibrium Fermi level E f
relative to E i .
c. Calculate and sketch the position of quasi-Fermi levels E fn and E fp
relative to E i .