

140
V. M. Xanat and Y. Toshimasa
result reflects the considerable quantity of English architecture videos, and a preference for content related to theory and interdisciplinarity. Women in SC and BSC
countries were mostly industrial design students (12, 0.6% and 4, 0.2%; respectively)
shown in Shell related videos.
As for Spanish videos, 16 (2%) from BC countries showed diverse women actors
in architecture, and 9 (1.1%), women professors in the mixed area. The video content
was related to architecture; and engineering and fashion design respectively. 14
(1.7%) videos from SC countries showed women students and 8 (1%), business
related women in the mixed area. Most of such content was about fashion design.
Finally, 16 (2%) videos from BSC countries showed women architects.
10.3.3 YouTube Metrics and Qualitative Descriptions of Top
Videos
Previous literature (Vargas Meza 2019) found that the most reliable metric of
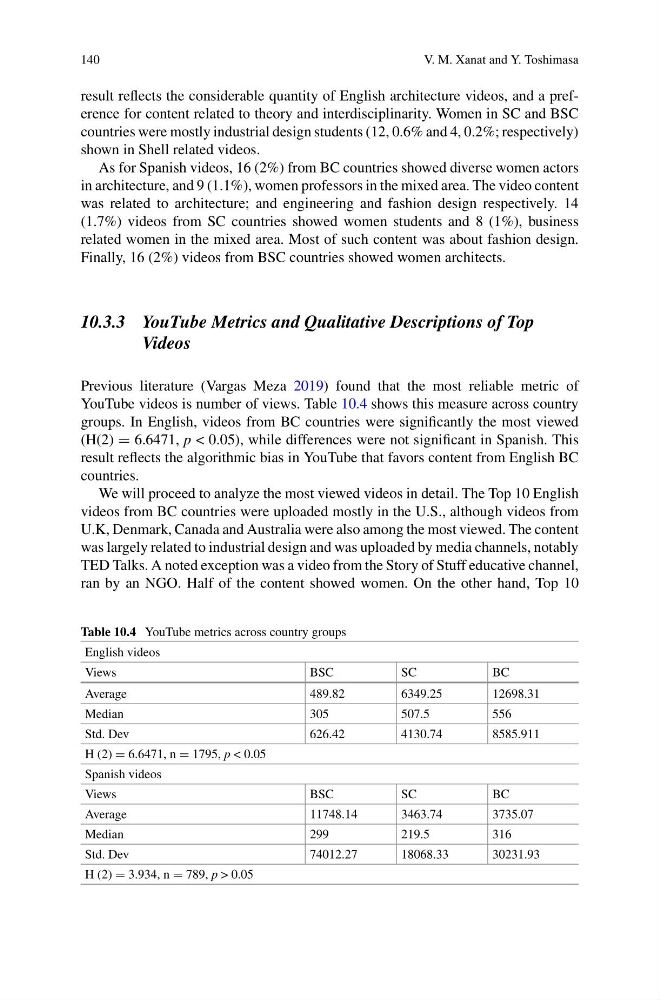
YouTube videos is number of views. Table 10.4 shows this measure across country
groups. In English, videos from BC countries were significantly the most viewed
(H(2) = 6.6471, p < 0.05), while differences were not significant in Spanish. This
result reflects the algorithmic bias in YouTube that favors content from English BC
countries.
We will proceed to analyze the most viewed videos in detail. The Top 10 English
videos from BC countries were uploaded mostly in the U.S., although videos from
U.K, Denmark, Canada and Australia were also among the most viewed. The content
was largely related to industrial design and was uploaded by media channels, notably
TED Talks. A noted exception was a video from the Story of Stuff educative channel,
ran by an NGO. Half of the content showed women. On the other hand, Top 10
Table 10.4 YouTube metrics across country groups
English videos
Views
BSC
SC
BC
Average
489.82
6349.25
12698.31
Median
305
507.5
556
Std. Dev
626.42
4130.74
8585.911
H (2) = 6.6471, n = 1795, p < 0.05
Spanish videos
Views
BSC
SC
BC
Average
11748.14
3463.74
3735.07
Median
299
219.5
316
Std. Dev
74012.27
18068.33
30231.93
H (2) = 3.934, n = 789, p > 0.05
V. M. Xanat and Y. Toshimasa
result reflects the considerable quantity of English architecture videos, and a preference for content related to theory and interdisciplinarity. Women in SC and BSC
countries were mostly industrial design students (12, 0.6% and 4, 0.2%; respectively)
shown in Shell related videos.
As for Spanish videos, 16 (2%) from BC countries showed diverse women actors
in architecture, and 9 (1.1%), women professors in the mixed area. The video content
was related to architecture; and engineering and fashion design respectively. 14
(1.7%) videos from SC countries showed women students and 8 (1%), business
related women in the mixed area. Most of such content was about fashion design.
Finally, 16 (2%) videos from BSC countries showed women architects.
10.3.3 YouTube Metrics and Qualitative Descriptions of Top
Videos
Previous literature (Vargas Meza 2019) found that the most reliable metric of
YouTube videos is number of views. Table 10.4 shows this measure across country
groups. In English, videos from BC countries were significantly the most viewed
(H(2) = 6.6471, p < 0.05), while differences were not significant in Spanish. This
result reflects the algorithmic bias in YouTube that favors content from English BC
countries.
We will proceed to analyze the most viewed videos in detail. The Top 10 English
videos from BC countries were uploaded mostly in the U.S., although videos from
U.K, Denmark, Canada and Australia were also among the most viewed. The content
was largely related to industrial design and was uploaded by media channels, notably
TED Talks. A noted exception was a video from the Story of Stuff educative channel,
ran by an NGO. Half of the content showed women. On the other hand, Top 10
Table 10.4 YouTube metrics across country groups
English videos
Views
BSC
SC
BC
Average
489.82
6349.25
12698.31
Median
305
507.5
556
Std. Dev
626.42
4130.74
8585.911
H (2) = 6.6471, n = 1795, p < 0.05
Spanish videos
Views
BSC
SC
BC
Average
11748.14
3463.74
3735.07
Median
299
219.5
316
Std. Dev
74012.27
18068.33
30231.93
H (2) = 3.934, n = 789, p > 0.05