

0°
10°
20°
30°
40°
50°
–40°
–30°
–20°
–10°
0°
10°
20°
2 2 m m /y r
1 6
m
m
/ y r
Nubia
Arabia
Somalia
R e d
S e a
G u lf o f
A d e n
NB–SO pole
5
mm/yr
3
mm/yr
Continental earthquakes and tectonics 335
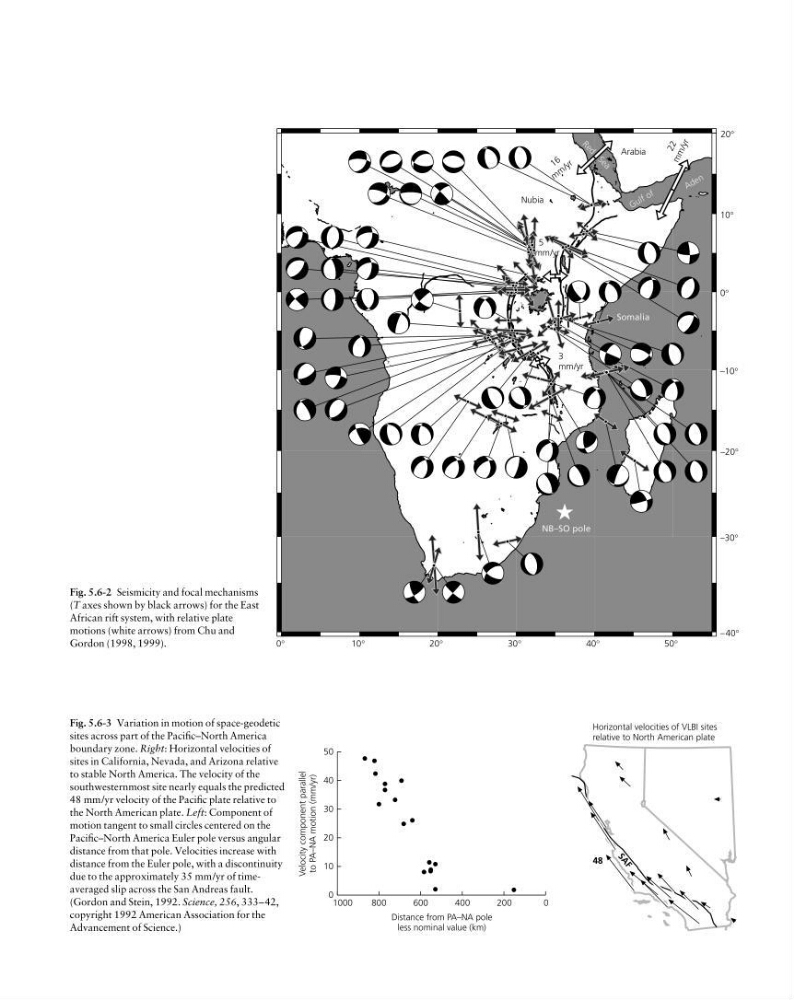
Fig. 5.6-3 Variation in motion of space-geodetic
sites across part of the Pacific–North America
boundary zone. Right: Horizontal velocities of
sites in California, Nevada, and Arizona relative
to stable North America. The velocity of the
southwesternmost site nearly equals the predicted
48 mm/yr velocity of the Pacific plate relative to
the North American plate. Left: Component of
motion tangent to small circles centered on the
Pacific–North America Euler pole versus angular
distance from that pole. Velocities increase with
distance from the Euler pole, with a discontinuity
due to the approximately 35 mm/yr of timeaveraged slip across the San Andreas fault.
(Gordon and Stein, 1992. Science, 256, 333–42,
copyright 1992 American Association for the
Advancement of Science.)
Horizontal velocities of VLBI sites
relative to North American plate
48
S
A
F
Velocity component parallel
to PA–NA motion (mm/yr)
50
40
30
20
10
0
800
1000
600
Distance from PA–NA pole
less nominal value (km)
400
200
0
Fig. 5.6-2 Seismicity and focal mechanisms
(T axes shown by black arrows) for the East
African rift system, with relative plate
motions (white arrows) from Chu and
Gordon (1998, 1999).
10°
20°
30°
40°
50°
–40°
–30°
–20°
–10°
0°
10°
20°
2 2 m m /y r
1 6
m
m
/ y r
Nubia
Arabia
Somalia
R e d
S e a
G u lf o f
A d e n
NB–SO pole
5
mm/yr
3
mm/yr
Continental earthquakes and tectonics 335
Fig. 5.6-3 Variation in motion of space-geodetic
sites across part of the Pacific–North America
boundary zone. Right: Horizontal velocities of
sites in California, Nevada, and Arizona relative
to stable North America. The velocity of the
southwesternmost site nearly equals the predicted
48 mm/yr velocity of the Pacific plate relative to
the North American plate. Left: Component of
motion tangent to small circles centered on the
Pacific–North America Euler pole versus angular
distance from that pole. Velocities increase with
distance from the Euler pole, with a discontinuity
due to the approximately 35 mm/yr of timeaveraged slip across the San Andreas fault.
(Gordon and Stein, 1992. Science, 256, 333–42,
copyright 1992 American Association for the
Advancement of Science.)
Horizontal velocities of VLBI sites
relative to North American plate
48
S
A
F
Velocity component parallel
to PA–NA motion (mm/yr)
50
40
30
20
10
0
800
1000
600
Distance from PA–NA pole
less nominal value (km)
400
200
0
Fig. 5.6-2 Seismicity and focal mechanisms
(T axes shown by black arrows) for the East
African rift system, with relative plate
motions (white arrows) from Chu and
Gordon (1998, 1999).