

324 Seismology and Plate Tectonics
Slip (m)
30
20
10
200
Nazca−South America
Chile 40°S
Plate motions
RM1
Chase
RM2
NUVEL-1
11.0 cm/yr
10.8 cm/yr
9.1 cm/yr
8.7 cm/yr
Seismic slip
(Kanamori, 1977)
100
Repeat time (yr)
1894 (7.9)
N
Kushiro
Hokkaido
K u r il 1 s .
1918
(8
1
/4)
1 9 6 3
1 9 5 8
1 9 6 9
1 9 7 3
1 9 5 2
1843 (8.4)
1856 (7.8)
1968
Pl at e m o ti o n
100 km
Honshu
Repeat time
~100 yr
P la te m o ti o n
1968 1969
1963
1952
1973
N
W
0
5
10
Velocity (cm/yr)
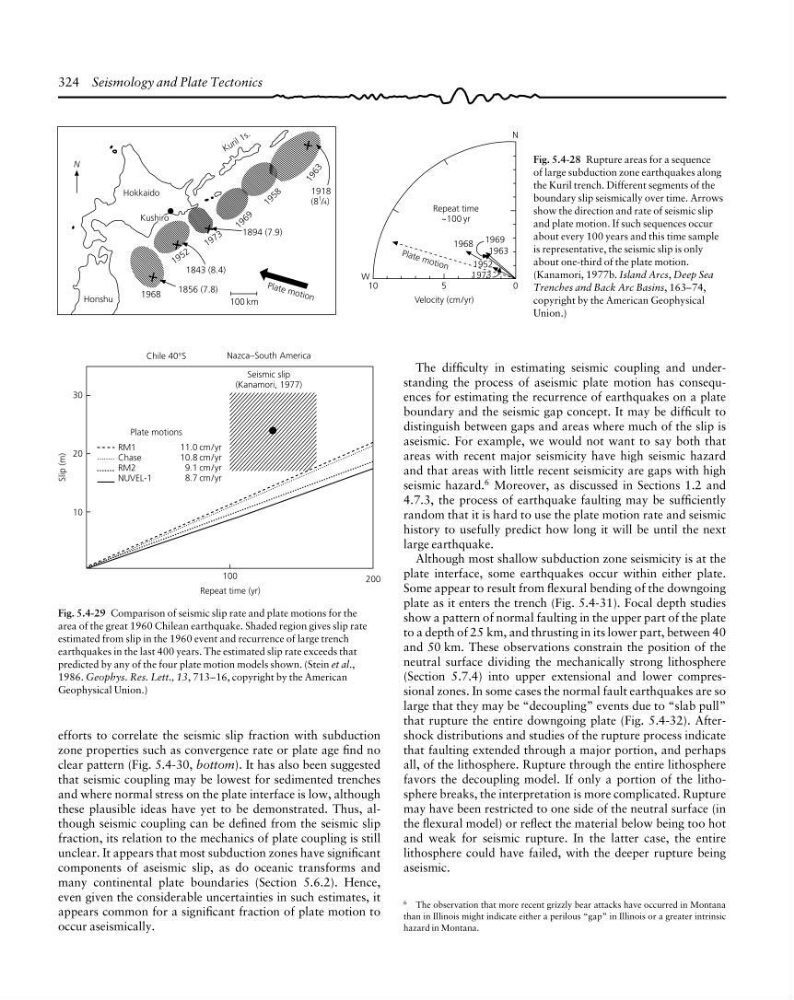
Fig. 5.4-28 Rupture areas for a sequence
of large subduction zone earthquakes along
the Kuril trench. Different segments of the
boundary slip seismically over time. Arrows
show the direction and rate of seismic slip
and plate motion. If such sequences occur
about every 100 years and this time sample
is representative, the seismic slip is only
about one-third of the plate motion.
(Kanamori, 1977b. Island Arcs, Deep Sea
Trenches and Back Arc Basins, 163–74,
copyright by the American Geophysical
Union.)
Fig. 5.4-29 Comparison of seismic slip rate and plate motions for the
area of the great 1960 Chilean earthquake. Shaded region gives slip rate
estimated from slip in the 1960 event and recurrence of large trench
earthquakes in the last 400 years. The estimated slip rate exceeds that
predicted by any of the four plate motion models shown. (Stein et al.,
1986. Geophys. Res. Lett., 13, 713–16, copyright by the American
Geophysical Union.)
6 The observation that more recent grizzly bear attacks have occurred in Montana
than in Illinois might indicate either a perilous “gap” in Illinois or a greater intrinsic
hazard in Montana.
efforts to correlate the seismic slip fraction with subduction
zone properties such as convergence rate or plate age find no
clear pattern (Fig. 5.4-30, bottom). It has also been suggested
that seismic coupling may be lowest for sedimented trenches
and where normal stress on the plate interface is low, although
these plausible ideas have yet to be demonstrated. Thus, although seismic coupling can be defined from the seismic slip
fraction, its relation to the mechanics of plate coupling is still
unclear. It appears that most subduction zones have significant
components of aseismic slip, as do oceanic transforms and
many continental plate boundaries (Section 5.6.2). Hence,
even given the considerable uncertainties in such estimates, it
appears common for a significant fraction of plate motion to
occur aseismically.
The difficulty in estimating seismic coupling and understanding the process of aseismic plate motion has consequences for estimating the recurrence of earthquakes on a plate
boundary and the seismic gap concept. It may be difficult to
distinguish between gaps and areas where much of the slip is
aseismic. For example, we would not want to say both that
areas with recent major seismicity have high seismic hazard
and that areas with little recent seismicity are gaps with high
seismic hazard. 6 Moreover, as discussed in Sections 1.2 and
4.7.3, the process of earthquake faulting may be sufficiently
random that it is hard to use the plate motion rate and seismic
history to usefully predict how long it will be until the next
large earthquake.
Although most shallow subduction zone seismicity is at the
plate interface, some earthquakes occur within either plate.
Some appear to result from flexural bending of the downgoing
plate as it enters the trench (Fig. 5.4-31). Focal depth studies
show a pattern of normal faulting in the upper part of the plate
to a depth of 25 km, and thrusting in its lower part, between 40
and 50 km. These observations constrain the position of the
neutral surface dividing the mechanically strong lithosphere
(Section 5.7.4) into upper extensional and lower compressional zones. In some cases the normal fault earthquakes are so
large that they may be “decoupling” events due to “slab pull”
that rupture the entire downgoing plate (Fig. 5.4-32). Aftershock distributions and studies of the rupture process indicate
that faulting extended through a major portion, and perhaps
all, of the lithosphere. Rupture through the entire lithosphere
favors the decoupling model. If only a portion of the lithosphere breaks, the interpretation is more complicated. Rupture
may have been restricted to one side of the neutral surface (in
the flexural model) or reflect the material below being too hot
and weak for seismic rupture. In the latter case, the entire
lithosphere could have failed, with the deeper rupture being
aseismic.
Slip (m)
30
20
10
200
Nazca−South America
Chile 40°S
Plate motions
RM1
Chase
RM2
NUVEL-1
11.0 cm/yr
10.8 cm/yr
9.1 cm/yr
8.7 cm/yr
Seismic slip
(Kanamori, 1977)
100
Repeat time (yr)
1894 (7.9)
N
Kushiro
Hokkaido
K u r il 1 s .
1918
(8
1
/4)
1 9 6 3
1 9 5 8
1 9 6 9
1 9 7 3
1 9 5 2
1843 (8.4)
1856 (7.8)
1968
Pl at e m o ti o n
100 km
Honshu
Repeat time
~100 yr
P la te m o ti o n
1968 1969
1963
1952
1973
N
W
0
5
10
Velocity (cm/yr)
Fig. 5.4-28 Rupture areas for a sequence
of large subduction zone earthquakes along
the Kuril trench. Different segments of the
boundary slip seismically over time. Arrows
show the direction and rate of seismic slip
and plate motion. If such sequences occur
about every 100 years and this time sample
is representative, the seismic slip is only
about one-third of the plate motion.
(Kanamori, 1977b. Island Arcs, Deep Sea
Trenches and Back Arc Basins, 163–74,
copyright by the American Geophysical
Union.)
Fig. 5.4-29 Comparison of seismic slip rate and plate motions for the
area of the great 1960 Chilean earthquake. Shaded region gives slip rate
estimated from slip in the 1960 event and recurrence of large trench
earthquakes in the last 400 years. The estimated slip rate exceeds that
predicted by any of the four plate motion models shown. (Stein et al.,
1986. Geophys. Res. Lett., 13, 713–16, copyright by the American
Geophysical Union.)
6 The observation that more recent grizzly bear attacks have occurred in Montana
than in Illinois might indicate either a perilous “gap” in Illinois or a greater intrinsic
hazard in Montana.
efforts to correlate the seismic slip fraction with subduction
zone properties such as convergence rate or plate age find no
clear pattern (Fig. 5.4-30, bottom). It has also been suggested
that seismic coupling may be lowest for sedimented trenches
and where normal stress on the plate interface is low, although
these plausible ideas have yet to be demonstrated. Thus, although seismic coupling can be defined from the seismic slip
fraction, its relation to the mechanics of plate coupling is still
unclear. It appears that most subduction zones have significant
components of aseismic slip, as do oceanic transforms and
many continental plate boundaries (Section 5.6.2). Hence,
even given the considerable uncertainties in such estimates, it
appears common for a significant fraction of plate motion to
occur aseismically.
The difficulty in estimating seismic coupling and understanding the process of aseismic plate motion has consequences for estimating the recurrence of earthquakes on a plate
boundary and the seismic gap concept. It may be difficult to
distinguish between gaps and areas where much of the slip is
aseismic. For example, we would not want to say both that
areas with recent major seismicity have high seismic hazard
and that areas with little recent seismicity are gaps with high
seismic hazard. 6 Moreover, as discussed in Sections 1.2 and
4.7.3, the process of earthquake faulting may be sufficiently
random that it is hard to use the plate motion rate and seismic
history to usefully predict how long it will be until the next
large earthquake.
Although most shallow subduction zone seismicity is at the
plate interface, some earthquakes occur within either plate.
Some appear to result from flexural bending of the downgoing
plate as it enters the trench (Fig. 5.4-31). Focal depth studies
show a pattern of normal faulting in the upper part of the plate
to a depth of 25 km, and thrusting in its lower part, between 40
and 50 km. These observations constrain the position of the
neutral surface dividing the mechanically strong lithosphere
(Section 5.7.4) into upper extensional and lower compressional zones. In some cases the normal fault earthquakes are so
large that they may be “decoupling” events due to “slab pull”
that rupture the entire downgoing plate (Fig. 5.4-32). Aftershock distributions and studies of the rupture process indicate
that faulting extended through a major portion, and perhaps
all, of the lithosphere. Rupture through the entire lithosphere
favors the decoupling model. If only a portion of the lithosphere breaks, the interpretation is more complicated. Rupture
may have been restricted to one side of the neutral surface (in
the flexural model) or reflect the material below being too hot
and weak for seismic rupture. In the latter case, the entire
lithosphere could have failed, with the deeper rupture being
aseismic.