

292 Seismology and Plate Tectonics
2 2 0 °
2 2 0 °
2 4 0 °
2 4 0 °
26 0°
2 6 0 °
280° 280°
2 0 °
4
0
°
40°
6 0 °
60°
8 0 °
2 0 0 °
J F
p la t e
San Francisco1906
Parkfield
Alaska1964
San Fernando
Borah Peak
.
.
.
.
.
Landers
Northridge
Loma Prieta
T r e n c h
ri
d
g
e
S
A
F
tr
a
n
sf
o
rm
Basin and
RANGE Range
PA–NA
pole
V
PA
-N
A
5
9
m
m
/y
r
80°
JF-N A
V
42 mm /yr
GPS site
motion
boundary zone contains the small Juan de Fuca plate, which
subducts beneath the Pacific Northwest at the Cascadia
subduction zone.
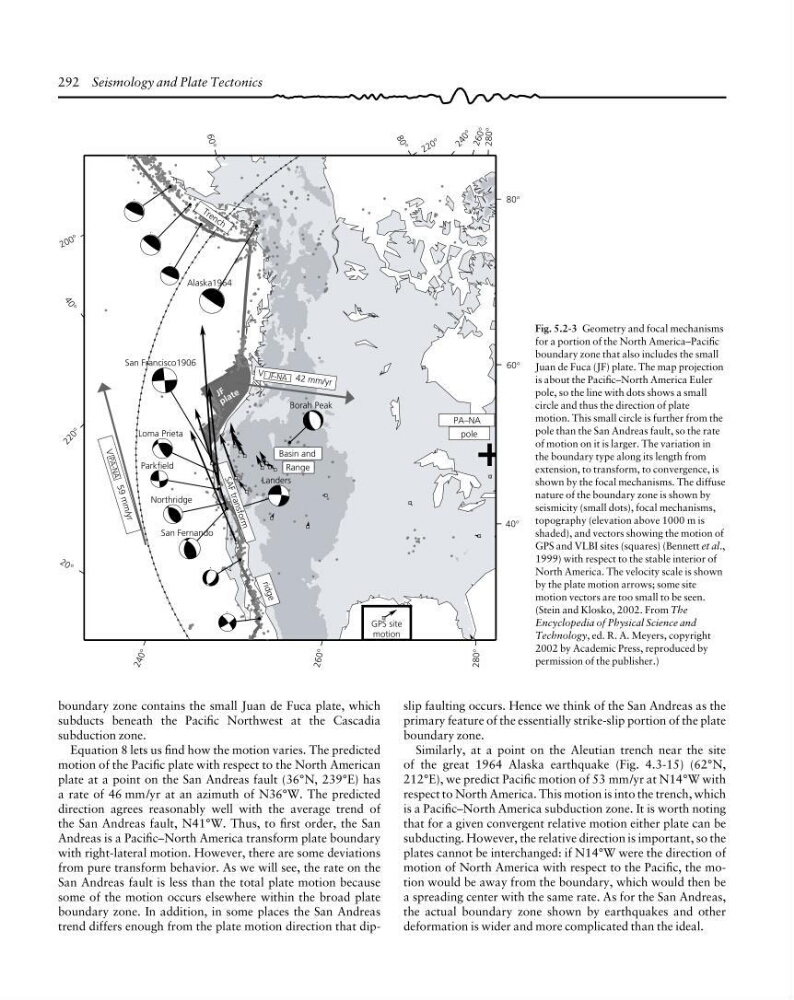
Equation 8 lets us find how the motion varies. The predicted
motion of the Pacific plate with respect to the North American
plate at a point on the San Andreas fault (36°N, 239°E) has
a rate of 46 mm/yr at an azimuth of N36°W. The predicted
direction agrees reasonably well with the average trend of
the San Andreas fault, N41°W. Thus, to first order, the San
Andreas is a Pacific–North America transform plate boundary
with right-lateral motion. However, there are some deviations
from pure transform behavior. As we will see, the rate on the
San Andreas fault is less than the total plate motion because
some of the motion occurs elsewhere within the broad plate
boundary zone. In addition, in some places the San Andreas
trend differs enough from the plate motion direction that dipslip faulting occurs. Hence we think of the San Andreas as the
primary feature of the essentially strike-slip portion of the plate
boundary zone.
Similarly, at a point on the Aleutian trench near the site
of the great 1964 Alaska earthquake (Fig. 4.3-15) (62°N,
212°E), we predict Pacific motion of 53 mm/yr at N14°W with
respect to North America. This motion is into the trench, which
is a Pacific–North America subduction zone. It is worth noting
that for a given convergent relative motion either plate can be
subducting. However, the relative direction is important, so the
plates cannot be interchanged: if N14°W were the direction of
motion of North America with respect to the Pacific, the motion would be away from the boundary, which would then be
a spreading center with the same rate. As for the San Andreas,
the actual boundary zone shown by earthquakes and other
deformation is wider and more complicated than the ideal.
Fig. 5.2-3 Geometry and focal mechanisms
for a portion of the North America–Pacific
boundary zone that also includes the small
Juan de Fuca (JF) plate. The map projection
is about the Pacific–North America Euler
pole, so the line with dots shows a small
circle and thus the direction of plate
motion. This small circle is further from the
pole than the San Andreas fault, so the rate
of motion on it is larger. The variation in
the boundary type along its length from
extension, to transform, to convergence, is
shown by the focal mechanisms. The diffuse
nature of the boundary zone is shown by
seismicity (small dots), focal mechanisms,
topography (elevation above 1000 m is
shaded), and vectors showing the motion of
GPS and VLBI sites (squares) (Bennett et al.,
1999) with respect to the stable interior of
North America. The velocity scale is shown
by the plate motion arrows; some site
motion vectors are too small to be seen.
(Stein and Klosko, 2002. From The
Encyclopedia of Physical Science and
Technology, ed. R. A. Meyers, copyright
2002 by Academic Press, reproduced by
permission of the publisher.)
2 2 0 °
2 2 0 °
2 4 0 °
2 4 0 °
26 0°
2 6 0 °
280° 280°
2 0 °
4
0
°
40°
6 0 °
60°
8 0 °
2 0 0 °
J F
p la t e
San Francisco1906
Parkfield
Alaska1964
San Fernando
Borah Peak
.
.
.
.
.
Landers
Northridge
Loma Prieta
T r e n c h
ri
d
g
e
S
A
F
tr
a
n
sf
o
rm
Basin and
RANGE Range
PA–NA
pole
V
PA
-N
A
5
9
m
m
/y
r
80°
JF-N A
V
42 mm /yr
GPS site
motion
boundary zone contains the small Juan de Fuca plate, which
subducts beneath the Pacific Northwest at the Cascadia
subduction zone.
Equation 8 lets us find how the motion varies. The predicted
motion of the Pacific plate with respect to the North American
plate at a point on the San Andreas fault (36°N, 239°E) has
a rate of 46 mm/yr at an azimuth of N36°W. The predicted
direction agrees reasonably well with the average trend of
the San Andreas fault, N41°W. Thus, to first order, the San
Andreas is a Pacific–North America transform plate boundary
with right-lateral motion. However, there are some deviations
from pure transform behavior. As we will see, the rate on the
San Andreas fault is less than the total plate motion because
some of the motion occurs elsewhere within the broad plate
boundary zone. In addition, in some places the San Andreas
trend differs enough from the plate motion direction that dipslip faulting occurs. Hence we think of the San Andreas as the
primary feature of the essentially strike-slip portion of the plate
boundary zone.
Similarly, at a point on the Aleutian trench near the site
of the great 1964 Alaska earthquake (Fig. 4.3-15) (62°N,
212°E), we predict Pacific motion of 53 mm/yr at N14°W with
respect to North America. This motion is into the trench, which
is a Pacific–North America subduction zone. It is worth noting
that for a given convergent relative motion either plate can be
subducting. However, the relative direction is important, so the
plates cannot be interchanged: if N14°W were the direction of
motion of North America with respect to the Pacific, the motion would be away from the boundary, which would then be
a spreading center with the same rate. As for the San Andreas,
the actual boundary zone shown by earthquakes and other
deformation is wider and more complicated than the ideal.
Fig. 5.2-3 Geometry and focal mechanisms
for a portion of the North America–Pacific
boundary zone that also includes the small
Juan de Fuca (JF) plate. The map projection
is about the Pacific–North America Euler
pole, so the line with dots shows a small
circle and thus the direction of plate
motion. This small circle is further from the
pole than the San Andreas fault, so the rate
of motion on it is larger. The variation in
the boundary type along its length from
extension, to transform, to convergence, is
shown by the focal mechanisms. The diffuse
nature of the boundary zone is shown by
seismicity (small dots), focal mechanisms,
topography (elevation above 1000 m is
shaded), and vectors showing the motion of
GPS and VLBI sites (squares) (Bennett et al.,
1999) with respect to the stable interior of
North America. The velocity scale is shown
by the plate motion arrows; some site
motion vectors are too small to be seen.
(Stein and Klosko, 2002. From The
Encyclopedia of Physical Science and
Technology, ed. R. A. Meyers, copyright
2002 by Academic Press, reproduced by
permission of the publisher.)