

− 1 2 0 °
− 1 2 0 ˚
−1 10 °
−1 10 °
−100°
−100˚
−90°
−90˚
−8 0°
−8 0˚
− 7 0 °
− 7 0 °
3 0 °
3 0 °
4 0 °
4 0 °
5 0 °
5 0 °
2
2
4
4
4
4
4
6
6
6
6
6
6
6
6
8
8
8
8
8
8
8
8
1
0
1 0
1 0
10
10
1 0
1 0
1 0
1 0
1
0
2 0
2 0
20
2 0
2 0
20
2 0
20
20
2 0
6 0
6 0
6 0
80
80
8 0
0
2
4
6
8
10
12
14
16
18
20
30
40
50
60
80
120
160
200
300
Nov. 1996
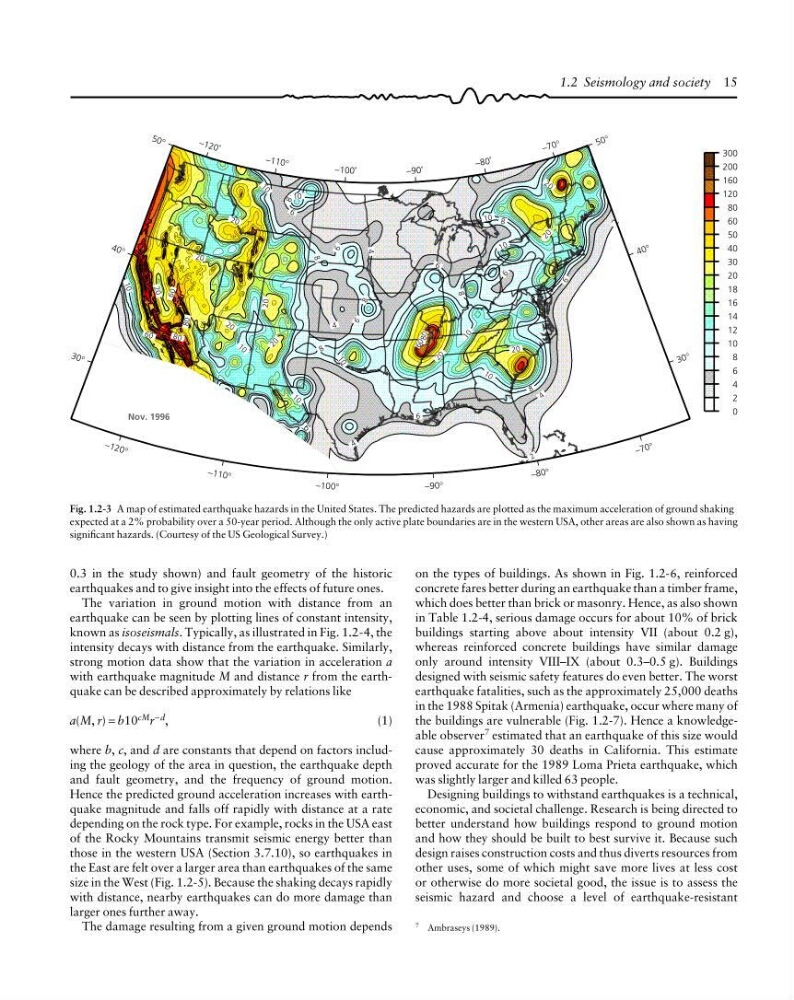
Fig. 1.2-3 A map of estimated earthquake hazards in the United States. The predicted hazards are plotted as the maximum acceleration of ground shaking
expected at a 2% probability over a 50-year period. Although the only active plate boundaries are in the western USA, other areas are also shown as having
significant hazards. (Courtesy of the US Geological Survey.)
0.3 in the study shown) and fault geometry of the historic
earthquakes and to give insight into the effects of future ones.
The variation in ground motion with distance from an
earthquake can be seen by plotting lines of constant intensity,
known as isoseismals. Typically, as illustrated in Fig. 1.2-4, the
intensity decays with distance from the earthquake. Similarly,
strong motion data show that the variation in acceleration a
with earthquake magnitude M and distance r from the earthquake can be described approximately by relations like
a(M, r) = b10 cM r −d ,
(1)
where b, c, and d are constants that depend on factors including the geology of the area in question, the earthquake depth
and fault geometry, and the frequency of ground motion.
Hence the predicted ground acceleration increases with earthquake magnitude and falls off rapidly with distance at a rate
depending on the rock type. For example, rocks in the USA east
of the Rocky Mountains transmit seismic energy better than
those in the western USA (Section 3.7.10), so earthquakes in
the East are felt over a larger area than earthquakes of the same
size in the West (Fig. 1.2-5). Because the shaking decays rapidly
with distance, nearby earthquakes can do more damage than
larger ones further away.
The damage resulting from a given ground motion depends
on the types of buildings. As shown in Fig. 1.2-6, reinforced
concrete fares better during an earthquake than a timber frame,
which does better than brick or masonry. Hence, as also shown
in Table 1.2-4, serious damage occurs for about 10% of brick
buildings starting above about intensity VII (about 0.2 g),
whereas reinforced concrete buildings have similar damage
only around intensity VIII–IX (about 0.3–0.5 g). Buildings
designed with seismic safety features do even better. The worst
earthquake fatalities, such as the approximately 25,000 deaths
in the 1988 Spitak (Armenia) earthquake, occur where many of
the buildings are vulnerable (Fig. 1.2-7). Hence a knowledgeable observer 7 estimated that an earthquake of this size would
cause approximately 30 deaths in California. This estimate
proved accurate for the 1989 Loma Prieta earthquake, which
was slightly larger and killed 63 people.
Designing buildings to withstand earthquakes is a technical,
economic, and societal challenge. Research is being directed to
better understand how buildings respond to ground motion
and how they should be built to best survive it. Because such
design raises construction costs and thus diverts resources from
other uses, some of which might save more lives at less cost
or otherwise do more societal good, the issue is to assess the
seismic hazard and choose a level of earthquake-resistant
7 Ambraseys (1989).
1.2 Seismology and society 15
− 1 2 0 ˚
−1 10 °
−1 10 °
−100°
−100˚
−90°
−90˚
−8 0°
−8 0˚
− 7 0 °
− 7 0 °
3 0 °
3 0 °
4 0 °
4 0 °
5 0 °
5 0 °
2
2
4
4
4
4
4
6
6
6
6
6
6
6
6
8
8
8
8
8
8
8
8
1
0
1 0
1 0
10
10
1 0
1 0
1 0
1 0
1
0
2 0
2 0
20
2 0
2 0
20
2 0
20
20
2 0
6 0
6 0
6 0
80
80
8 0
0
2
4
6
8
10
12
14
16
18
20
30
40
50
60
80
120
160
200
300
Nov. 1996
Fig. 1.2-3 A map of estimated earthquake hazards in the United States. The predicted hazards are plotted as the maximum acceleration of ground shaking
expected at a 2% probability over a 50-year period. Although the only active plate boundaries are in the western USA, other areas are also shown as having
significant hazards. (Courtesy of the US Geological Survey.)
0.3 in the study shown) and fault geometry of the historic
earthquakes and to give insight into the effects of future ones.
The variation in ground motion with distance from an
earthquake can be seen by plotting lines of constant intensity,
known as isoseismals. Typically, as illustrated in Fig. 1.2-4, the
intensity decays with distance from the earthquake. Similarly,
strong motion data show that the variation in acceleration a
with earthquake magnitude M and distance r from the earthquake can be described approximately by relations like
a(M, r) = b10 cM r −d ,
(1)
where b, c, and d are constants that depend on factors including the geology of the area in question, the earthquake depth
and fault geometry, and the frequency of ground motion.
Hence the predicted ground acceleration increases with earthquake magnitude and falls off rapidly with distance at a rate
depending on the rock type. For example, rocks in the USA east
of the Rocky Mountains transmit seismic energy better than
those in the western USA (Section 3.7.10), so earthquakes in
the East are felt over a larger area than earthquakes of the same
size in the West (Fig. 1.2-5). Because the shaking decays rapidly
with distance, nearby earthquakes can do more damage than
larger ones further away.
The damage resulting from a given ground motion depends
on the types of buildings. As shown in Fig. 1.2-6, reinforced
concrete fares better during an earthquake than a timber frame,
which does better than brick or masonry. Hence, as also shown
in Table 1.2-4, serious damage occurs for about 10% of brick
buildings starting above about intensity VII (about 0.2 g),
whereas reinforced concrete buildings have similar damage
only around intensity VIII–IX (about 0.3–0.5 g). Buildings
designed with seismic safety features do even better. The worst
earthquake fatalities, such as the approximately 25,000 deaths
in the 1988 Spitak (Armenia) earthquake, occur where many of
the buildings are vulnerable (Fig. 1.2-7). Hence a knowledgeable observer 7 estimated that an earthquake of this size would
cause approximately 30 deaths in California. This estimate
proved accurate for the 1989 Loma Prieta earthquake, which
was slightly larger and killed 63 people.
Designing buildings to withstand earthquakes is a technical,
economic, and societal challenge. Research is being directed to
better understand how buildings respond to ground motion
and how they should be built to best survive it. Because such
design raises construction costs and thus diverts resources from
other uses, some of which might save more lives at less cost
or otherwise do more societal good, the issue is to assess the
seismic hazard and choose a level of earthquake-resistant
7 Ambraseys (1989).
1.2 Seismology and society 15