

262 Earthquakes
Trench–normal (cm/yr)
6
5
4
3
2
1
0
−1
600
550
500
450
400
350
300
250
200
150
100
50
Vertical (cm/yr)
3
2
1
0
−1
−2
−3
600
550
500
450
400
350
300
250
200
150
100
50
Model (km)
0
−20
− 40
− 60
− 80
−100
600
550
500
450
400
350
300
250
200
150
100
50
Distance from trench (km)
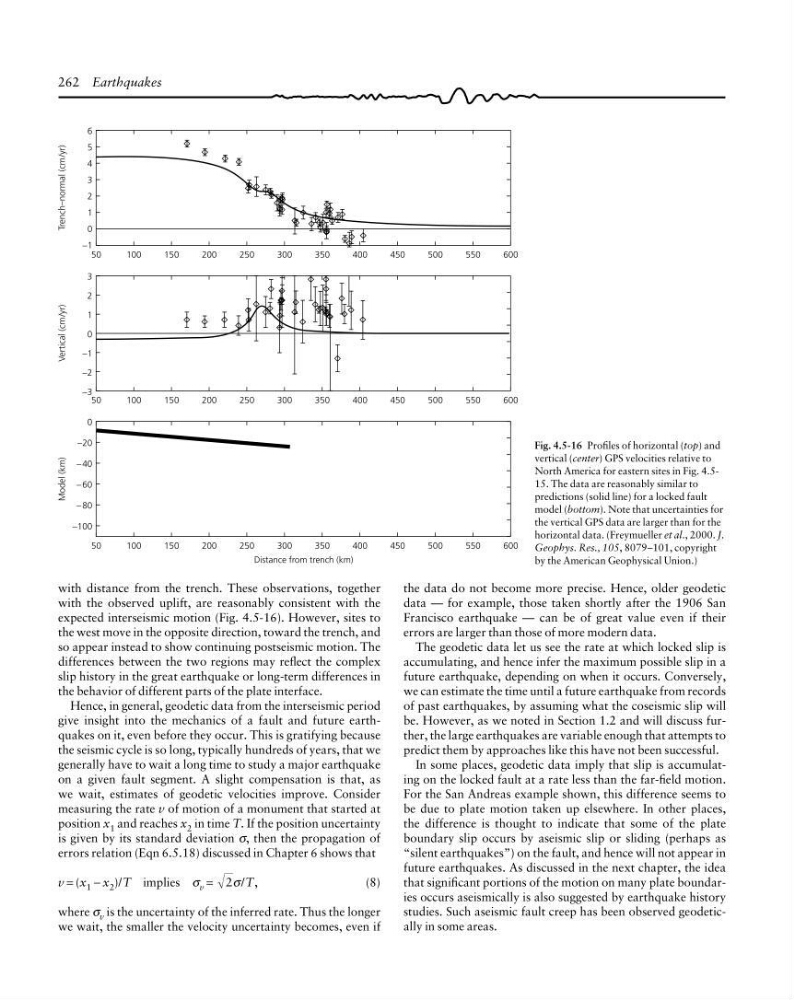
Fig. 4.5-16 Profiles of horizontal (top) and
vertical (center) GPS velocities relative to
North America for eastern sites in Fig. 4.515. The data are reasonably similar to
predictions (solid line) for a locked fault
model (bottom). Note that uncertainties for
the vertical GPS data are larger than for the
horizontal data. (Freymueller et al., 2000. J.
Geophys. Res., 105, 8079–101, copyright
by the American Geophysical Union.)
the data do not become more precise. Hence, older geodetic
data — for example, those taken shortly after the 1906 San
Francisco earthquake — can be of great value even if their
errors are larger than those of more modern data.
The geodetic data let us see the rate at which locked slip is
accumulating, and hence infer the maximum possible slip in a
future earthquake, depending on when it occurs. Conversely,
we can estimate the time until a future earthquake from records
of past earthquakes, by assuming what the coseismic slip will
be. However, as we noted in Section 1.2 and will discuss further, the large earthquakes are variable enough that attempts to
predict them by approaches like this have not been successful.
In some places, geodetic data imply that slip is accumulating on the locked fault at a rate less than the far-field motion.
For the San Andreas example shown, this difference seems to
be due to plate motion taken up elsewhere. In other places,
the difference is thought to indicate that some of the plate
boundary slip occurs by aseismic slip or sliding (perhaps as
“silent earthquakes”) on the fault, and hence will not appear in
future earthquakes. As discussed in the next chapter, the idea
that significant portions of the motion on many plate boundaries occurs aseismically is also suggested by earthquake history
studies. Such aseismic fault creep has been observed geodetically in some areas.
with distance from the trench. These observations, together
with the observed uplift, are reasonably consistent with the
expected interseismic motion (Fig. 4.5-16). However, sites to
the west move in the opposite direction, toward the trench, and
so appear instead to show continuing postseismic motion. The
differences between the two regions may reflect the complex
slip history in the great earthquake or long-term differences in
the behavior of different parts of the plate interface.
Hence, in general, geodetic data from the interseismic period
give insight into the mechanics of a fault and future earthquakes on it, even before they occur. This is gratifying because
the seismic cycle is so long, typically hundreds of years, that we
generally have to wait a long time to study a major earthquake
on a given fault segment. A slight compensation is that, as
we wait, estimates of geodetic velocities improve. Consider
measuring the rate v of motion of a monument that started at
position x 1 and reaches x 2 in time T. If the position uncertainty
is given by its standard deviation σ, then the propagation of
errors relation (Eqn 6.5.18) discussed in Chapter 6 shows that
v = (x 1 − x 2 )/T implies σ v = 2 σ/T,
(8)
where σ v is the uncertainty of the inferred rate. Thus the longer
we wait, the smaller the velocity uncertainty becomes, even if
Trench–normal (cm/yr)
6
5
4
3
2
1
0
−1
600
550
500
450
400
350
300
250
200
150
100
50
Vertical (cm/yr)
3
2
1
0
−1
−2
−3
600
550
500
450
400
350
300
250
200
150
100
50
Model (km)
0
−20
− 40
− 60
− 80
−100
600
550
500
450
400
350
300
250
200
150
100
50
Distance from trench (km)
Fig. 4.5-16 Profiles of horizontal (top) and
vertical (center) GPS velocities relative to
North America for eastern sites in Fig. 4.515. The data are reasonably similar to
predictions (solid line) for a locked fault
model (bottom). Note that uncertainties for
the vertical GPS data are larger than for the
horizontal data. (Freymueller et al., 2000. J.
Geophys. Res., 105, 8079–101, copyright
by the American Geophysical Union.)
the data do not become more precise. Hence, older geodetic
data — for example, those taken shortly after the 1906 San
Francisco earthquake — can be of great value even if their
errors are larger than those of more modern data.
The geodetic data let us see the rate at which locked slip is
accumulating, and hence infer the maximum possible slip in a
future earthquake, depending on when it occurs. Conversely,
we can estimate the time until a future earthquake from records
of past earthquakes, by assuming what the coseismic slip will
be. However, as we noted in Section 1.2 and will discuss further, the large earthquakes are variable enough that attempts to
predict them by approaches like this have not been successful.
In some places, geodetic data imply that slip is accumulating on the locked fault at a rate less than the far-field motion.
For the San Andreas example shown, this difference seems to
be due to plate motion taken up elsewhere. In other places,
the difference is thought to indicate that some of the plate
boundary slip occurs by aseismic slip or sliding (perhaps as
“silent earthquakes”) on the fault, and hence will not appear in
future earthquakes. As discussed in the next chapter, the idea
that significant portions of the motion on many plate boundaries occurs aseismically is also suggested by earthquake history
studies. Such aseismic fault creep has been observed geodetically in some areas.
with distance from the trench. These observations, together
with the observed uplift, are reasonably consistent with the
expected interseismic motion (Fig. 4.5-16). However, sites to
the west move in the opposite direction, toward the trench, and
so appear instead to show continuing postseismic motion. The
differences between the two regions may reflect the complex
slip history in the great earthquake or long-term differences in
the behavior of different parts of the plate interface.
Hence, in general, geodetic data from the interseismic period
give insight into the mechanics of a fault and future earthquakes on it, even before they occur. This is gratifying because
the seismic cycle is so long, typically hundreds of years, that we
generally have to wait a long time to study a major earthquake
on a given fault segment. A slight compensation is that, as
we wait, estimates of geodetic velocities improve. Consider
measuring the rate v of motion of a monument that started at
position x 1 and reaches x 2 in time T. If the position uncertainty
is given by its standard deviation σ, then the propagation of
errors relation (Eqn 6.5.18) discussed in Chapter 6 shows that
v = (x 1 − x 2 )/T implies σ v = 2 σ/T,
(8)
where σ v is the uncertainty of the inferred rate. Thus the longer
we wait, the smaller the velocity uncertainty becomes, even if