

10 Introduction
Magnitude
10
9
8
7
6
5
4
3
2
Energy release (equivalent kilograms of explosive)
56,000,000,000,000
1,800,000,000,000
56,000,000,000
1,800,000,000
56,000,000
1,800,000
56,000
1,800
56
great earthquake
major earthquake
strong earthquake
moderate earthquake
light earthquake
minor earthquake
Chile (1960)
Alaska (1964)
San Francisco, CA (1906)
New Madrid, MO (1812)
Loma Prieta, CA (1989)
Kobe, Japan (1995)
Northridge, CA (1994)
Long Island, NY (1884)
Krakatoa eruption
<1
World’s largest nuclear test (USSR)
Mount St Helens eruption
Hiroshima atomic bomb
Average tornado
Large lightning bolt
Oklahoma City bombing
Moderate lightning bolt
Earthquakes
Energy equivalents
3
20
200
2,000
12,000
100,000
1,000,000
Number of earthquakes per year (worldwide)
0
70
360
30
60
90
120
150
180
210
240
270
300
330
60
−70
−60
−50
−40
−30
−20
−10
0
10
20
30
40
50
Longitude (°)
Latitude (°)
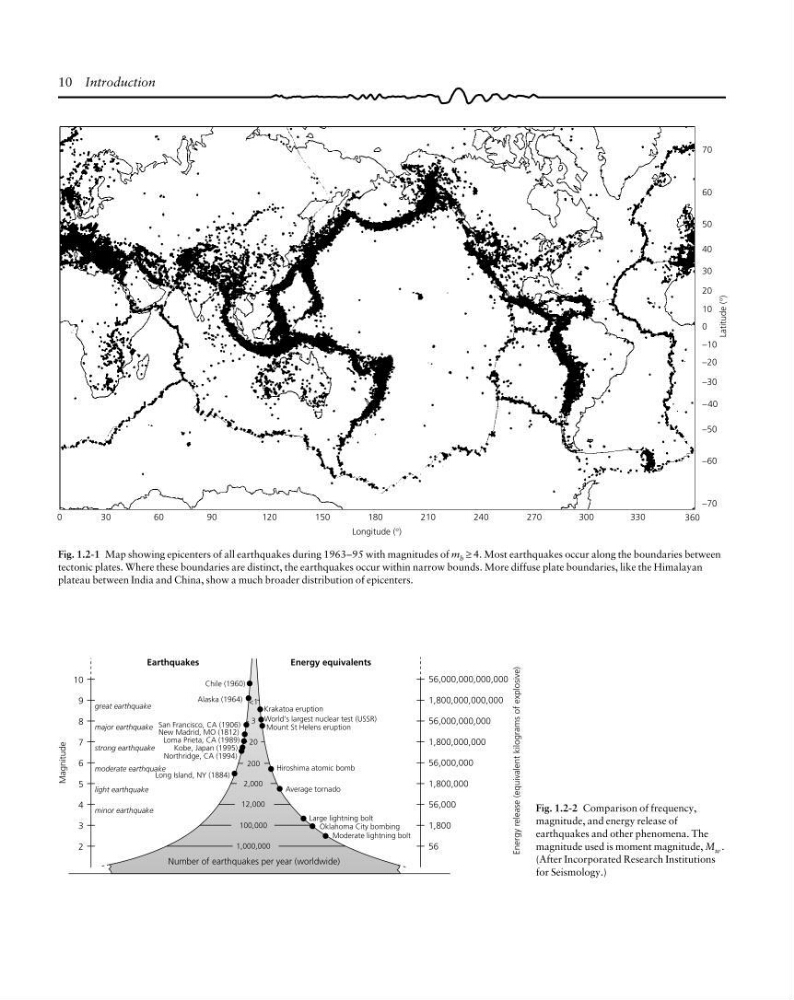
Fig. 1.2-1 Map showing epicenters of all earthquakes during 1963–95 with magnitudes of m b ≥ 4. Most earthquakes occur along the boundaries between
tectonic plates. Where these boundaries are distinct, the earthquakes occur within narrow bounds. More diffuse plate boundaries, like the Himalayan
plateau between India and China, show a much broader distribution of epicenters.
Fig. 1.2-2 Comparison of frequency,
magnitude, and energy release of
earthquakes and other phenomena. The
magnitude used is moment magnitude, M w .
(After Incorporated Research Institutions
for Seismology.)
Magnitude
10
9
8
7
6
5
4
3
2
Energy release (equivalent kilograms of explosive)
56,000,000,000,000
1,800,000,000,000
56,000,000,000
1,800,000,000
56,000,000
1,800,000
56,000
1,800
56
great earthquake
major earthquake
strong earthquake
moderate earthquake
light earthquake
minor earthquake
Chile (1960)
Alaska (1964)
San Francisco, CA (1906)
New Madrid, MO (1812)
Loma Prieta, CA (1989)
Kobe, Japan (1995)
Northridge, CA (1994)
Long Island, NY (1884)
Krakatoa eruption
<1
World’s largest nuclear test (USSR)
Mount St Helens eruption
Hiroshima atomic bomb
Average tornado
Large lightning bolt
Oklahoma City bombing
Moderate lightning bolt
Earthquakes
Energy equivalents
3
20
200
2,000
12,000
100,000
1,000,000
Number of earthquakes per year (worldwide)
0
70
360
30
60
90
120
150
180
210
240
270
300
330
60
−70
−60
−50
−40
−30
−20
−10
0
10
20
30
40
50
Longitude (°)
Latitude (°)
Fig. 1.2-1 Map showing epicenters of all earthquakes during 1963–95 with magnitudes of m b ≥ 4. Most earthquakes occur along the boundaries between
tectonic plates. Where these boundaries are distinct, the earthquakes occur within narrow bounds. More diffuse plate boundaries, like the Himalayan
plateau between India and China, show a much broader distribution of epicenters.
Fig. 1.2-2 Comparison of frequency,
magnitude, and energy release of
earthquakes and other phenomena. The
magnitude used is moment magnitude, M w .
(After Incorporated Research Institutions
for Seismology.)