

4.2 Focal mechanisms 223
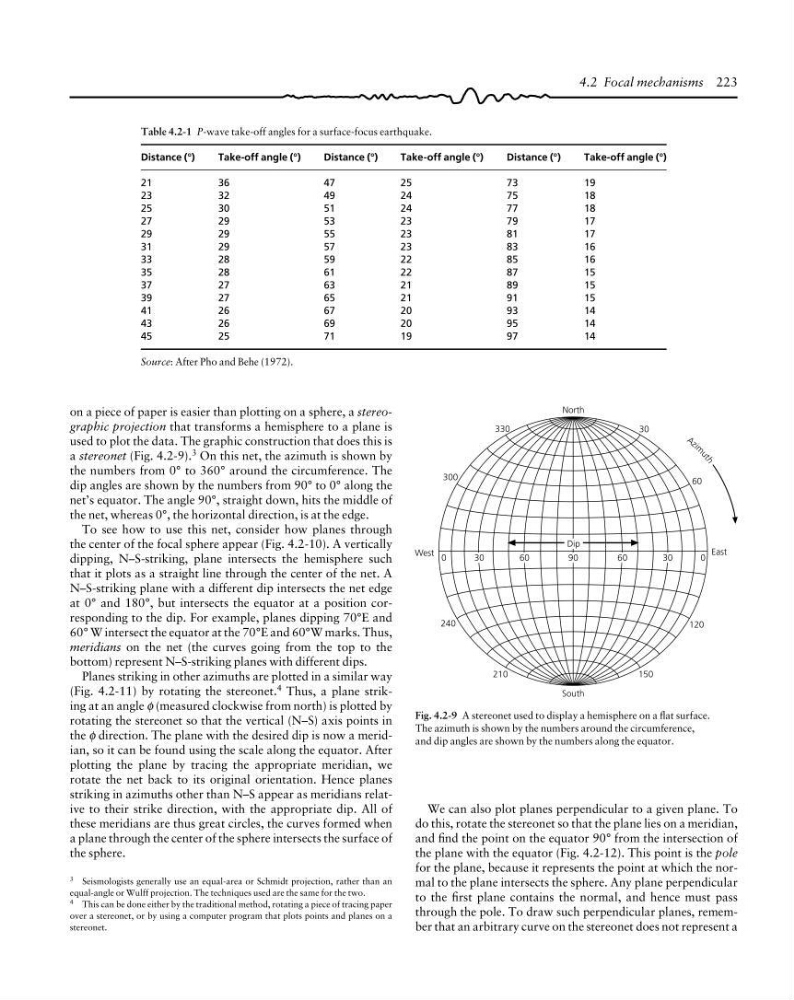
on a piece of paper is easier than plotting on a sphere, a stereographic projection that transforms a hemisphere to a plane is
used to plot the data. The graphic construction that does this is
a stereonet (Fig. 4.2-9). 3 On this net, the azimuth is shown by
the numbers from 0° to 360° around the circumference. The
dip angles are shown by the numbers from 90° to 0° along the
net’s equator. The angle 90°, straight down, hits the middle of
the net, whereas 0°, the horizontal direction, is at the edge.
To see how to use this net, consider how planes through
the center of the focal sphere appear (Fig. 4.2-10). A vertically
dipping, N–S-striking, plane intersects the hemisphere such
that it plots as a straight line through the center of the net. A
N–S-striking plane with a different dip intersects the net edge
at 0° and 180°, but intersects the equator at a position corresponding to the dip. For example, planes dipping 70°E and
60° W intersect the equator at the 70°E and 60°W marks. Thus,
meridians on the net (the curves going from the top to the
bottom) represent N–S-striking planes with different dips.
Planes striking in other azimuths are plotted in a similar way
(Fig. 4.2-11) by rotating the stereonet. 4 Thus, a plane striking at an angle φ (measured clockwise from north) is plotted by
rotating the stereonet so that the vertical (N–S) axis points in
the φ direction. The plane with the desired dip is now a meridian, so it can be found using the scale along the equator. After
plotting the plane by tracing the appropriate meridian, we
rotate the net back to its original orientation. Hence planes
striking in azimuths other than N–S appear as meridians relative to their strike direction, with the appropriate dip. All of
these meridians are thus great circles, the curves formed when
a plane through the center of the sphere intersects the surface of
the sphere.
Table 4.2-1 P-wave take-off angles for a surface-focus earthquake.
Distance (°)
Take-off angle (°)
Distance (°)
Take-off angle (°)
Distance (°)
Take-off angle (°)
21
36
47
25
73
19
23
32
49
24
75
18
25
30
51
24
77
18
27
29
53
23
79
17
29
29
55
23
81
17
31
29
57
23
83
16
33
28
59
22
85
16
35
28
61
22
87
15
37
27
63
21
89
15
39
27
65
21
91
15
41
26
67
20
93
14
43
26
69
20
95
14
45
25
71
19
97
14
Source: After Pho and Behe (1972).
3 Seismologists generally use an equal-area or Schmidt projection, rather than an
equal-angle or Wulff projection. The techniques used are the same for the two.
4 This can be done either by the traditional method, rotating a piece of tracing paper
over a stereonet, or by using a computer program that plots points and planes on a
stereonet.
Fig. 4.2-9 A stereonet used to display a hemisphere on a flat surface.
The azimuth is shown by the numbers around the circumference,
and dip angles are shown by the numbers along the equator.
We can also plot planes perpendicular to a given plane. To
do this, rotate the stereonet so that the plane lies on a meridian,
and find the point on the equator 90° from the intersection of
the plane with the equator (Fig. 4.2-12). This point is the pole
for the plane, because it represents the point at which the normal to the plane intersects the sphere. Any plane perpendicular
to the first plane contains the normal, and hence must pass
through the pole. To draw such perpendicular planes, remember that an arbitrary curve on the stereonet does not represent a
Dip
0
West
30
60
90
60
30
0
East
A z i m
u t h
30
60
150
120
210
240
300
330
North
South
on a piece of paper is easier than plotting on a sphere, a stereographic projection that transforms a hemisphere to a plane is
used to plot the data. The graphic construction that does this is
a stereonet (Fig. 4.2-9). 3 On this net, the azimuth is shown by
the numbers from 0° to 360° around the circumference. The
dip angles are shown by the numbers from 90° to 0° along the
net’s equator. The angle 90°, straight down, hits the middle of
the net, whereas 0°, the horizontal direction, is at the edge.
To see how to use this net, consider how planes through
the center of the focal sphere appear (Fig. 4.2-10). A vertically
dipping, N–S-striking, plane intersects the hemisphere such
that it plots as a straight line through the center of the net. A
N–S-striking plane with a different dip intersects the net edge
at 0° and 180°, but intersects the equator at a position corresponding to the dip. For example, planes dipping 70°E and
60° W intersect the equator at the 70°E and 60°W marks. Thus,
meridians on the net (the curves going from the top to the
bottom) represent N–S-striking planes with different dips.
Planes striking in other azimuths are plotted in a similar way
(Fig. 4.2-11) by rotating the stereonet. 4 Thus, a plane striking at an angle φ (measured clockwise from north) is plotted by
rotating the stereonet so that the vertical (N–S) axis points in
the φ direction. The plane with the desired dip is now a meridian, so it can be found using the scale along the equator. After
plotting the plane by tracing the appropriate meridian, we
rotate the net back to its original orientation. Hence planes
striking in azimuths other than N–S appear as meridians relative to their strike direction, with the appropriate dip. All of
these meridians are thus great circles, the curves formed when
a plane through the center of the sphere intersects the surface of
the sphere.
Table 4.2-1 P-wave take-off angles for a surface-focus earthquake.
Distance (°)
Take-off angle (°)
Distance (°)
Take-off angle (°)
Distance (°)
Take-off angle (°)
21
36
47
25
73
19
23
32
49
24
75
18
25
30
51
24
77
18
27
29
53
23
79
17
29
29
55
23
81
17
31
29
57
23
83
16
33
28
59
22
85
16
35
28
61
22
87
15
37
27
63
21
89
15
39
27
65
21
91
15
41
26
67
20
93
14
43
26
69
20
95
14
45
25
71
19
97
14
Source: After Pho and Behe (1972).
3 Seismologists generally use an equal-area or Schmidt projection, rather than an
equal-angle or Wulff projection. The techniques used are the same for the two.
4 This can be done either by the traditional method, rotating a piece of tracing paper
over a stereonet, or by using a computer program that plots points and planes on a
stereonet.
Fig. 4.2-9 A stereonet used to display a hemisphere on a flat surface.
The azimuth is shown by the numbers around the circumference,
and dip angles are shown by the numbers along the equator.
We can also plot planes perpendicular to a given plane. To
do this, rotate the stereonet so that the plane lies on a meridian,
and find the point on the equator 90° from the intersection of
the plane with the equator (Fig. 4.2-12). This point is the pole
for the plane, because it represents the point at which the normal to the plane intersects the sphere. Any plane perpendicular
to the first plane contains the normal, and hence must pass
through the pole. To draw such perpendicular planes, remember that an arbitrary curve on the stereonet does not represent a
Dip
0
West
30
60
90
60
30
0
East
A z i m
u t h
30
60
150
120
210
240
300
330
North
South