

4 Chalcophile (As, Cd, Cu, Hg, Ni, Pb, Zn) …
65
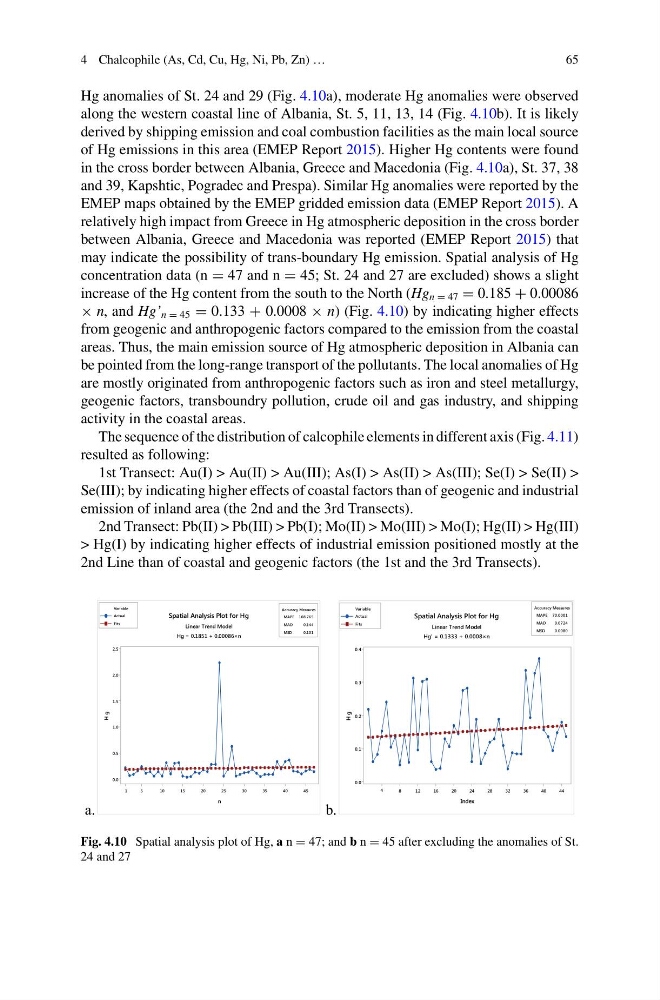
Hg anomalies of St. 24 and 29 (Fig. 4.10a), moderate Hg anomalies were observed
along the western coastal line of Albania, St. 5, 11, 13, 14 (Fig. 4.10b). It is likely
derived by shipping emission and coal combustion facilities as the main local source
of Hg emissions in this area (EMEP Report 2015). Higher Hg contents were found
in the cross border between Albania, Greece and Macedonia (Fig. 4.10a), St. 37, 38
and 39, Kapshtic, Pogradec and Prespa). Similar Hg anomalies were reported by the
EMEP maps obtained by the EMEP gridded emission data (EMEP Report 2015). A
relatively high impact from Greece in Hg atmospheric deposition in the cross border
between Albania, Greece and Macedonia was reported (EMEP Report 2015) that
may indicate the possibility of trans-boundary Hg emission. Spatial analysis of Hg
concentration data (n = 47 and n = 45; St. 24 and 27 are excluded) shows a slight
increase of the Hg content from the south to the North (Hg n = 47 = 0.185 + 0.00086
× n, and Hg’ n = 45 = 0.133 + 0.0008 × n) (Fig. 4.10) by indicating higher effects
from geogenic and anthropogenic factors compared to the emission from the coastal
areas. Thus, the main emission source of Hg atmospheric deposition in Albania can
be pointed from the long-range transport of the pollutants. The local anomalies of Hg
are mostly originated from anthropogenic factors such as iron and steel metallurgy,
geogenic factors, transboundry pollution, crude oil and gas industry, and shipping
activity in the coastal areas.
The sequence of the distribution of calcophile elements in different axis (Fig. 4.11)
resulted as following:
1st Transect: Au(I) > Au(II) > Au(III); As(I) > As(II) > As(III); Se(I) > Se(II) >
Se(III); by indicating higher effects of coastal factors than of geogenic and industrial
emission of inland area (the 2nd and the 3rd Transects).
2nd Transect: Pb(II) > Pb(III) > Pb(I); Mo(II) > Mo(III) > Mo(I); Hg(II) > Hg(III)
> Hg(I) by indicating higher effects of industrial emission positioned mostly at the
2nd Line than of coastal and geogenic factors (the 1st and the 3rd Transects).
a.
b.
45
40
35
30
25
20
15
10
5
1
2.5
2.0
1.5
1.0
0.5
0.0
MAPE 108.765
MAD
0.144
MSD
0.101
Accuracy Measures
n
H g
Actual
Fits
Variable
Spatial Analysis Plot for Hg
Linear Trend Model
Hg = 0.1851 + 0.00086×n
44
40
36
32
28
24
20
16
12
8
4
0.4
0.3
0.2
0.1
0.0
MAPE 70.0001
MAD
0.0724
MSD
0.0080
Accuracy Measures
Index
H g
Actual
Fits
Variable
Spatial Analysis Plot for Hg
Linear Trend Model
Hg' = 0.1333 + 0.0008×n
Fig. 4.10 Spatial analysis plot of Hg, a n = 47; and b n = 45 after excluding the anomalies of St.
24 and 27
65
Hg anomalies of St. 24 and 29 (Fig. 4.10a), moderate Hg anomalies were observed
along the western coastal line of Albania, St. 5, 11, 13, 14 (Fig. 4.10b). It is likely
derived by shipping emission and coal combustion facilities as the main local source
of Hg emissions in this area (EMEP Report 2015). Higher Hg contents were found
in the cross border between Albania, Greece and Macedonia (Fig. 4.10a), St. 37, 38
and 39, Kapshtic, Pogradec and Prespa). Similar Hg anomalies were reported by the
EMEP maps obtained by the EMEP gridded emission data (EMEP Report 2015). A
relatively high impact from Greece in Hg atmospheric deposition in the cross border
between Albania, Greece and Macedonia was reported (EMEP Report 2015) that
may indicate the possibility of trans-boundary Hg emission. Spatial analysis of Hg
concentration data (n = 47 and n = 45; St. 24 and 27 are excluded) shows a slight
increase of the Hg content from the south to the North (Hg n = 47 = 0.185 + 0.00086
× n, and Hg’ n = 45 = 0.133 + 0.0008 × n) (Fig. 4.10) by indicating higher effects
from geogenic and anthropogenic factors compared to the emission from the coastal
areas. Thus, the main emission source of Hg atmospheric deposition in Albania can
be pointed from the long-range transport of the pollutants. The local anomalies of Hg
are mostly originated from anthropogenic factors such as iron and steel metallurgy,
geogenic factors, transboundry pollution, crude oil and gas industry, and shipping
activity in the coastal areas.
The sequence of the distribution of calcophile elements in different axis (Fig. 4.11)
resulted as following:
1st Transect: Au(I) > Au(II) > Au(III); As(I) > As(II) > As(III); Se(I) > Se(II) >
Se(III); by indicating higher effects of coastal factors than of geogenic and industrial
emission of inland area (the 2nd and the 3rd Transects).
2nd Transect: Pb(II) > Pb(III) > Pb(I); Mo(II) > Mo(III) > Mo(I); Hg(II) > Hg(III)
> Hg(I) by indicating higher effects of industrial emission positioned mostly at the
2nd Line than of coastal and geogenic factors (the 1st and the 3rd Transects).
a.
b.
45
40
35
30
25
20
15
10
5
1
2.5
2.0
1.5
1.0
0.5
0.0
MAPE 108.765
MAD
0.144
MSD
0.101
Accuracy Measures
n
H g
Actual
Fits
Variable
Spatial Analysis Plot for Hg
Linear Trend Model
Hg = 0.1851 + 0.00086×n
44
40
36
32
28
24
20
16
12
8
4
0.4
0.3
0.2
0.1
0.0
MAPE 70.0001
MAD
0.0724
MSD
0.0080
Accuracy Measures
Index
H g
Actual
Fits
Variable
Spatial Analysis Plot for Hg
Linear Trend Model
Hg' = 0.1333 + 0.0008×n
Fig. 4.10 Spatial analysis plot of Hg, a n = 47; and b n = 45 after excluding the anomalies of St.
24 and 27