

64
P. Lazo et al.
45
40
35
30
25
20
15
10
5
1
0.200
0.175
0.150
0.125
0.100
0.075
0.050
MAPE 22.6073
MAD
0.0183
MSD
0.0007
Accuracy Measures
n
A g
Actual
Fits
Variable
Spatial Analysis Plot for Ag
Linear Trend Model
Ag= 0.0753 + 0.00046×n
45
40
35
30
25
20
15
10
5
1
0.05
0.04
0.03
0.02
0.01
0.00
MAPE 282.499
MAD
0.005
MSD
0.000
Accuracy Measures
n
Au
Actual
Fits
Variable
Spatial Analysis Plot for Au
Linear Trend Model
Au = 0.00777 - 0.000127×n
a.
b.
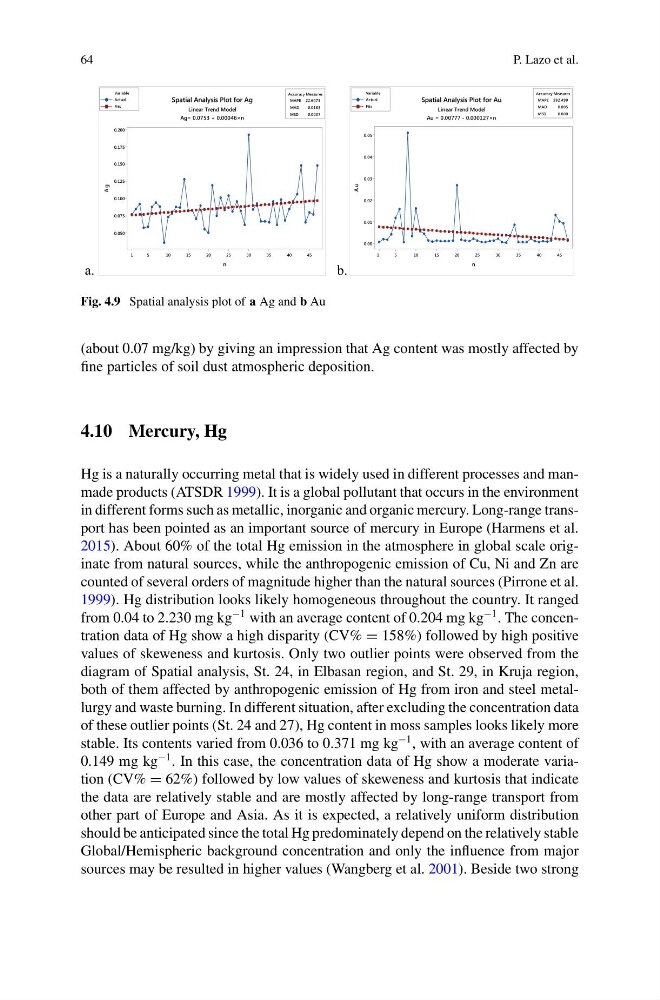
Fig. 4.9 Spatial analysis plot of a Ag and b Au
(about 0.07 mg/kg) by giving an impression that Ag content was mostly affected by
fine particles of soil dust atmospheric deposition.
4.10 Mercury, Hg
Hg is a naturally occurring metal that is widely used in different processes and manmade products (ATSDR 1999). It is a global pollutant that occurs in the environment
in different forms such as metallic, inorganic and organic mercury. Long-range transport has been pointed as an important source of mercury in Europe (Harmens et al.
2015). About 60% of the total Hg emission in the atmosphere in global scale originate from natural sources, while the anthropogenic emission of Cu, Ni and Zn are
counted of several orders of magnitude higher than the natural sources (Pirrone et al.
1999). Hg distribution looks likely homogeneous throughout the country. It ranged
from 0.04 to 2.230 mg kg
−1 with an average content of 0.204 mg kg
−1 . The concentration data of Hg show a high disparity (CV% = 158%) followed by high positive
values of skeweness and kurtosis. Only two outlier points were observed from the
diagram of Spatial analysis, St. 24, in Elbasan region, and St. 29, in Kruja region,
both of them affected by anthropogenic emission of Hg from iron and steel metallurgy and waste burning. In different situation, after excluding the concentration data
of these outlier points (St. 24 and 27), Hg content in moss samples looks likely more
stable. Its contents varied from 0.036 to 0.371 mg kg
−1 , with an average content of
0.149 mg kg
−1 . In this case, the concentration data of Hg show a moderate variation (CV% = 62%) followed by low values of skeweness and kurtosis that indicate
the data are relatively stable and are mostly affected by long-range transport from
other part of Europe and Asia. As it is expected, a relatively uniform distribution
should be anticipated since the total Hg predominately depend on the relatively stable
Global/Hemispheric background concentration and only the influence from major
sources may be resulted in higher values (Wangberg et al. 2001). Beside two strong
P. Lazo et al.
45
40
35
30
25
20
15
10
5
1
0.200
0.175
0.150
0.125
0.100
0.075
0.050
MAPE 22.6073
MAD
0.0183
MSD
0.0007
Accuracy Measures
n
A g
Actual
Fits
Variable
Spatial Analysis Plot for Ag
Linear Trend Model
Ag= 0.0753 + 0.00046×n
45
40
35
30
25
20
15
10
5
1
0.05
0.04
0.03
0.02
0.01
0.00
MAPE 282.499
MAD
0.005
MSD
0.000
Accuracy Measures
n
Au
Actual
Fits
Variable
Spatial Analysis Plot for Au
Linear Trend Model
Au = 0.00777 - 0.000127×n
a.
b.
Fig. 4.9 Spatial analysis plot of a Ag and b Au
(about 0.07 mg/kg) by giving an impression that Ag content was mostly affected by
fine particles of soil dust atmospheric deposition.
4.10 Mercury, Hg
Hg is a naturally occurring metal that is widely used in different processes and manmade products (ATSDR 1999). It is a global pollutant that occurs in the environment
in different forms such as metallic, inorganic and organic mercury. Long-range transport has been pointed as an important source of mercury in Europe (Harmens et al.
2015). About 60% of the total Hg emission in the atmosphere in global scale originate from natural sources, while the anthropogenic emission of Cu, Ni and Zn are
counted of several orders of magnitude higher than the natural sources (Pirrone et al.
1999). Hg distribution looks likely homogeneous throughout the country. It ranged
from 0.04 to 2.230 mg kg
−1 with an average content of 0.204 mg kg
−1 . The concentration data of Hg show a high disparity (CV% = 158%) followed by high positive
values of skeweness and kurtosis. Only two outlier points were observed from the
diagram of Spatial analysis, St. 24, in Elbasan region, and St. 29, in Kruja region,
both of them affected by anthropogenic emission of Hg from iron and steel metallurgy and waste burning. In different situation, after excluding the concentration data
of these outlier points (St. 24 and 27), Hg content in moss samples looks likely more
stable. Its contents varied from 0.036 to 0.371 mg kg
−1 , with an average content of
0.149 mg kg
−1 . In this case, the concentration data of Hg show a moderate variation (CV% = 62%) followed by low values of skeweness and kurtosis that indicate
the data are relatively stable and are mostly affected by long-range transport from
other part of Europe and Asia. As it is expected, a relatively uniform distribution
should be anticipated since the total Hg predominately depend on the relatively stable
Global/Hemispheric background concentration and only the influence from major
sources may be resulted in higher values (Wangberg et al. 2001). Beside two strong